
Factors That Affect Chemical Reaction Rates
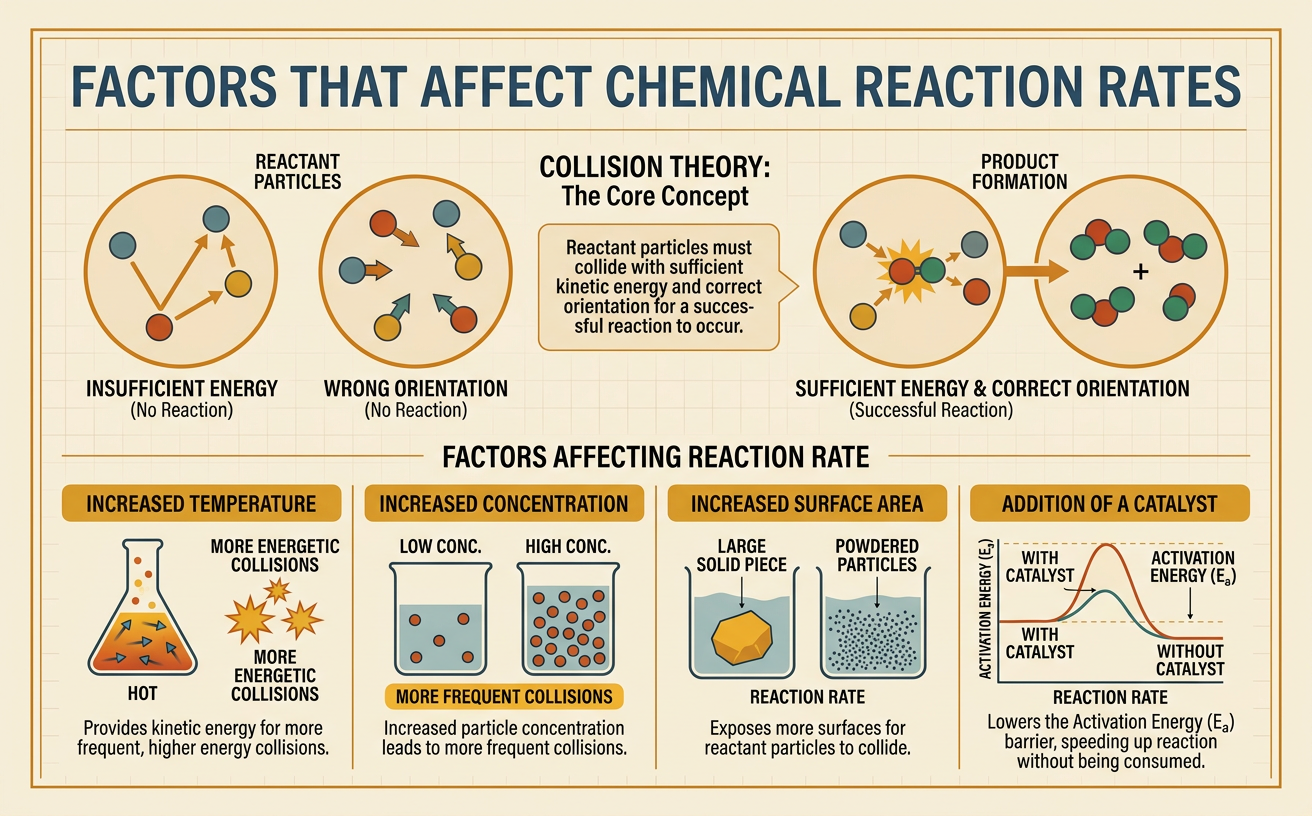
Students use collision theory and evidence from investigations to explain how temperature, concentration, surface area, and catalysts affect reaction rates.
Illustrations are auto-generated and may be placeholders. They can be refreshed to match the narration.
Defining Reaction Rate
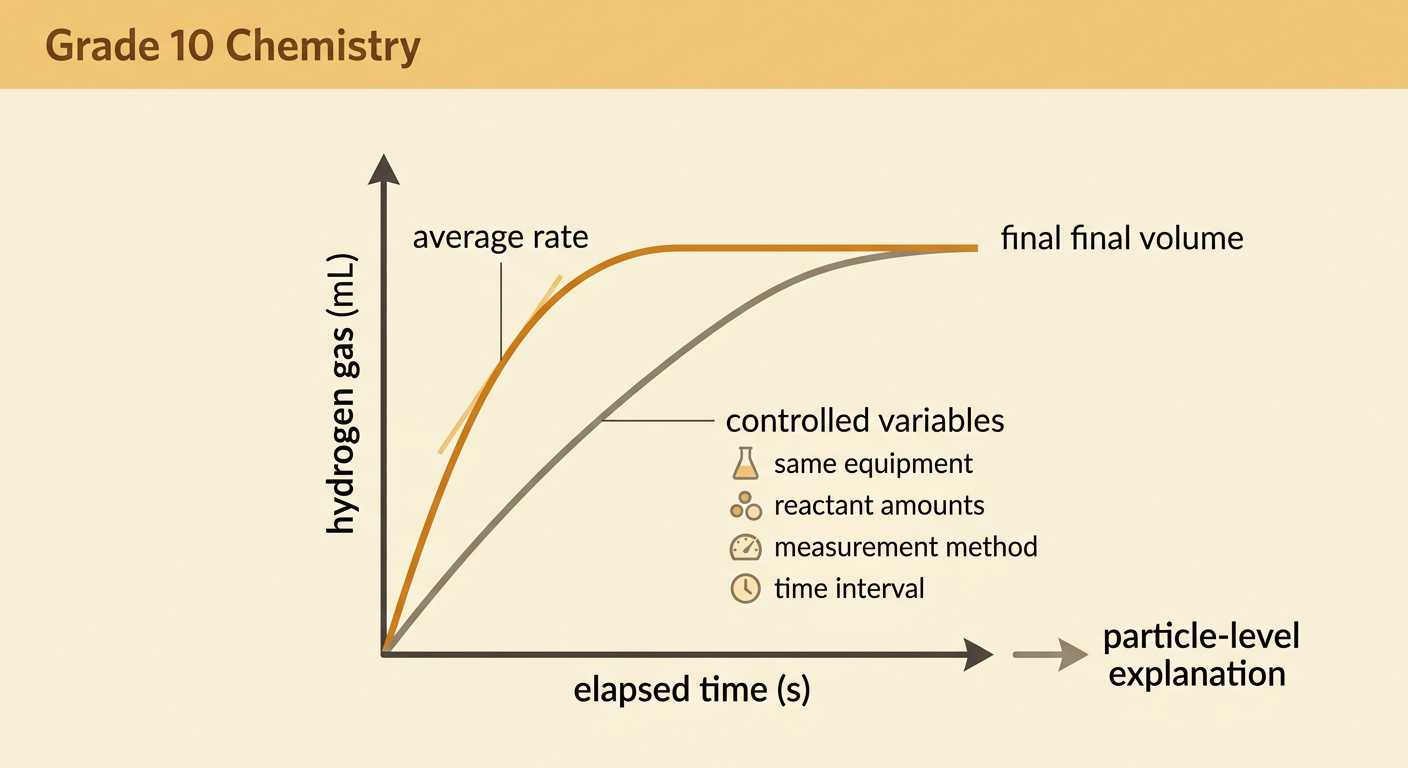
Reaction rate describes how quickly reactants are used up or products are formed. It can be measured as a change in concentration, mass, gas volume, color intensity, or another observable quantity divided by elapsed time. For example, when magnesium reacts with hydrochloric acid, hydrogen gas forms. If 48 milliliters of hydrogen is collected in 60 seconds, the average gas-production rate is 0.80 milliliter per second. A steeper graph of product amount versus time represents a faster rate. Reaction rates often decrease as a reaction proceeds because fewer reactant particles remain available. When comparing trials, use the same measurement method, time interval, reactant amounts, and equipment whenever possible. These controls help ensure that a difference in measured rate results from the condition being tested rather than from an unrelated variable.
Collision Theory
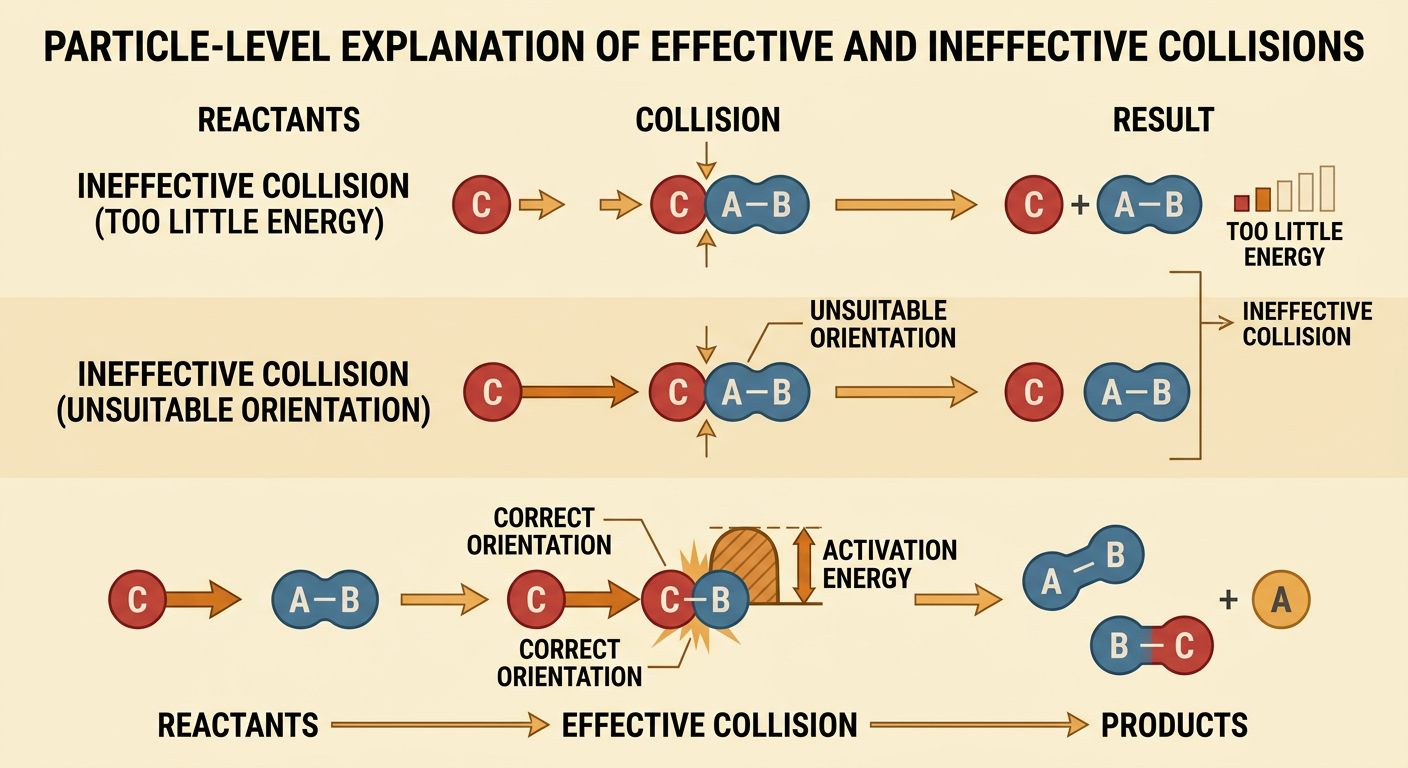
Collision theory explains reaction rate by focusing on particle interactions. Reactant particles must collide before their atoms can rearrange into products. However, not every collision causes a reaction. An effective collision must have enough energy to overcome the activation energy barrier and, for many reactions, a suitable orientation. Imagine molecule A–B reacting with C. If C strikes the correct end of A–B with sufficient energy, old bonds may break and new bonds may form. A low-energy collision or a collision at an ineffective angle leaves the particles unchanged. Reaction conditions affect rate by changing the frequency of collisions, the energy of collisions, or the activation energy required. A faster reaction therefore has more effective collisions per second, not necessarily more total particles or a greater final amount of product.
Temperature and Concentration
Increasing temperature usually speeds a reaction because particles move faster, collide more frequently, and collide with greater kinetic energy. Most importantly, a larger fraction of collisions can overcome the activation energy. For example, an effervescent tablet generally reacts faster in warm water than in cold water when tablet size and water volume are held constant. Increasing reactant concentration also usually raises the rate. More particles occupy the same volume, so collisions occur more often. For example, magnesium ribbon reacts faster in 2.0-molar hydrochloric acid than in 1.0-molar acid under otherwise identical conditions. Temperature and concentration affect rate in different particle-level ways: temperature changes particle speed and the energy distribution, while concentration changes the number of particles per unit volume. A fair investigation changes only one of these variables at a time and keeps the others controlled.

Surface Area and Catalysts
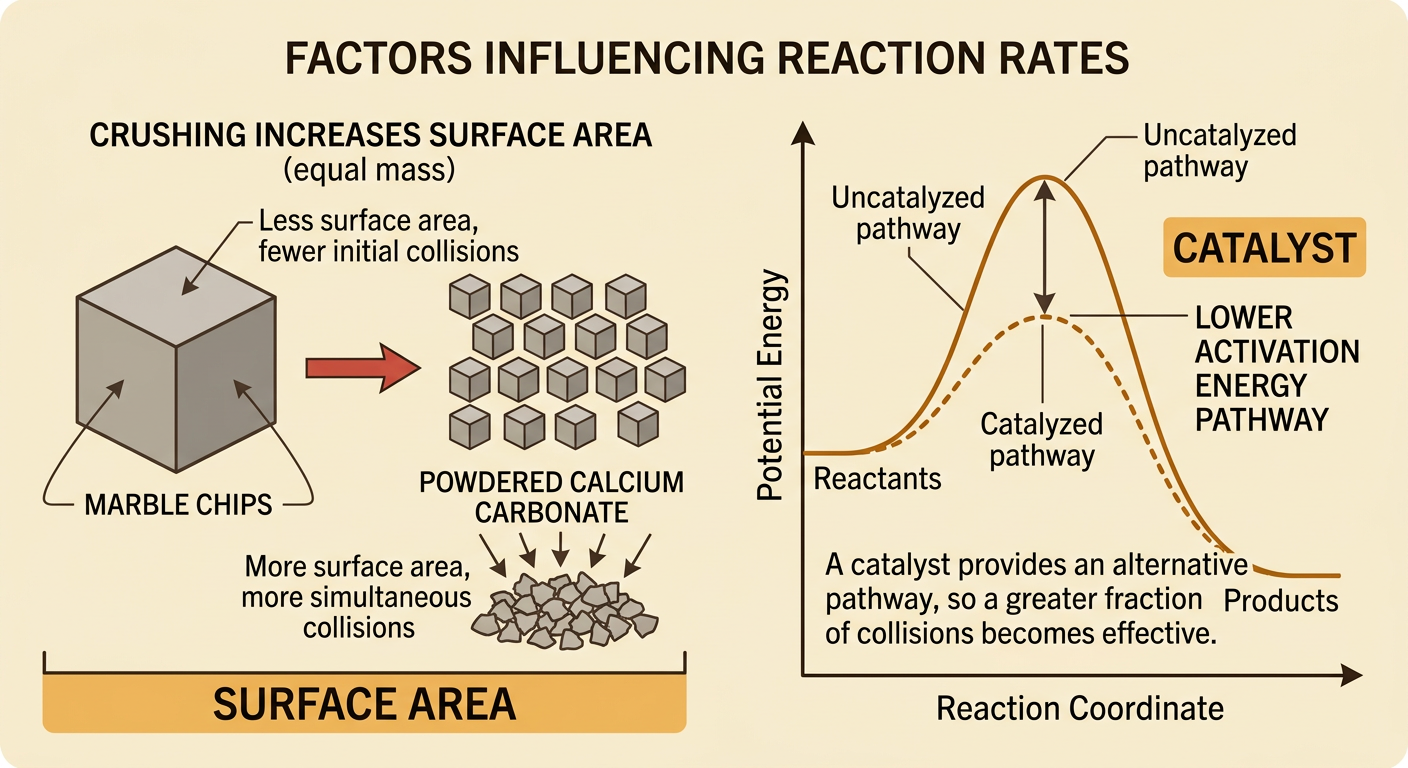
Surface area affects reactions involving a solid because only exposed particles can readily collide with particles of another reactant. Crushing a solid into smaller pieces increases its total exposed surface area without changing its mass. For example, powdered calcium carbonate reacts with hydrochloric acid faster than an equal mass of large marble chips because more calcium carbonate particles are available for collisions at once. A catalyst increases reaction rate in a different way. It provides an alternative reaction pathway with lower activation energy, so a greater fraction of collisions becomes effective. Manganese dioxide, for example, catalyzes the decomposition of hydrogen peroxide into water and oxygen. A catalyst participates in intermediate steps but is regenerated and is not consumed overall. It speeds both forward and reverse reactions and does not increase the final equilibrium yield; it only helps the system reach equilibrium faster.
Analyzing Rate Evidence
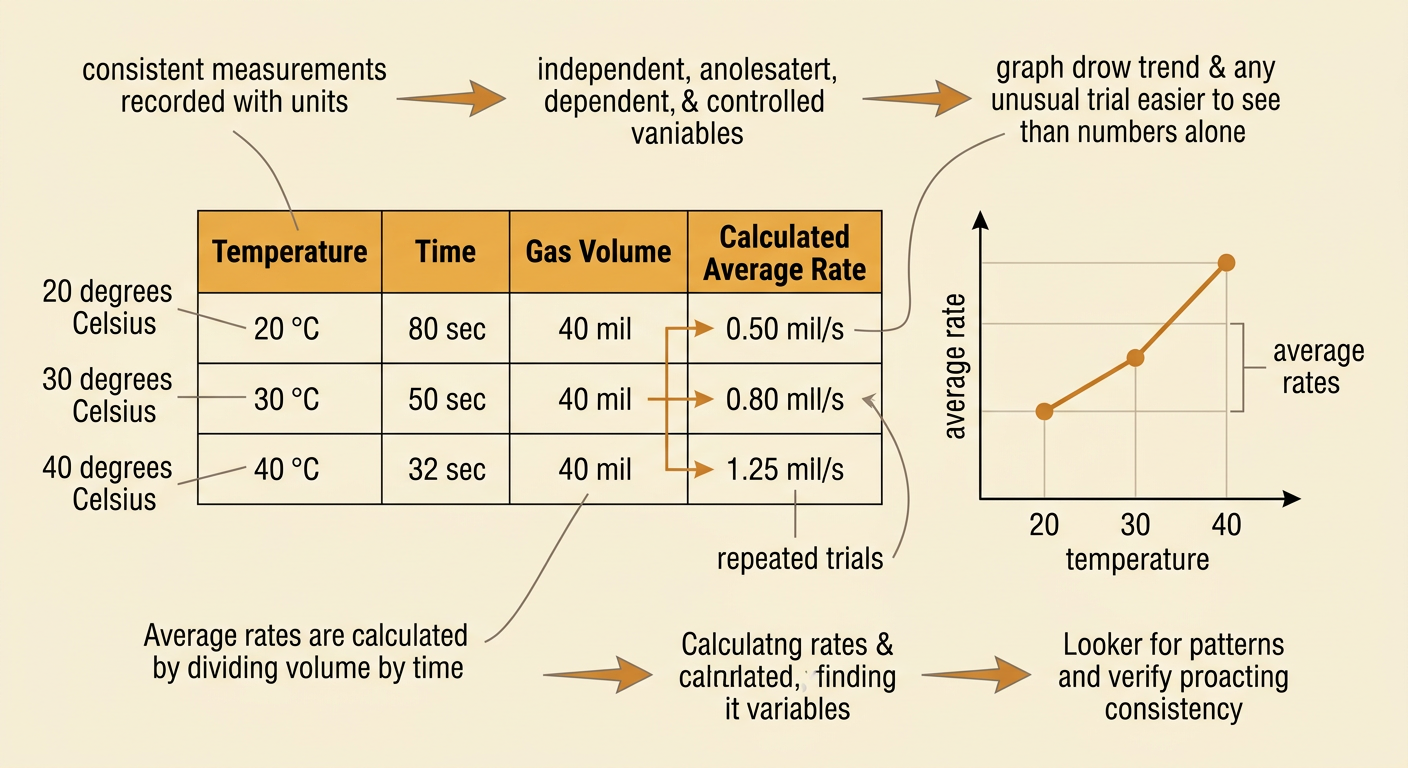
Reliable rate analysis begins with carefully following a multistep procedure and recording measurements with units. First identify the independent variable, dependent variable, and controlled variables. Then organize repeated-trial data, calculate rates, and look for patterns. Suppose equal magnesium samples produce 40 milliliters of hydrogen in 80 seconds at 20 degrees Celsius, 50 seconds at 30 degrees Celsius, and 32 seconds at 40 degrees Celsius. The average rates are 0.50, 0.80, and 1.25 milliliters per second, respectively. These values support a quantitative relationship between higher temperature and faster gas production. A graph can reveal trends and unusual trials more clearly than raw measurements. Repeated trials and averages reduce the influence of random variation. Before drawing a conclusion, check whether equipment, reactant amounts, mixing, timing, and measurement intervals remained consistent across all trials.
Explaining Results with Claims and Evidence
A strong scientific explanation includes a precise claim, relevant evidence, and reasoning based on scientific principles. Consider an investigation comparing powdered and chunk calcium carbonate. A claim might state that decreasing particle size increased the reaction rate. Evidence could include a shorter time to collect 50 milliliters of carbon dioxide, a steeper gas-volume graph, and similar results across repeated trials. The reasoning should connect that evidence to collision theory: powder has greater exposed surface area, allowing acid particles to collide with more calcium carbonate particles each second. Strong arguments also compare multiple sources, such as class data, another group’s results, and an accepted particle model. They acknowledge uncertainty and avoid claims the evidence cannot support. For example, faster gas production does not prove that more total gas will form. If conflicting data appear, evaluate procedural differences, measurement error, and sample size before revising the claim.
