
Factors That Affect Chemical Reaction Rates
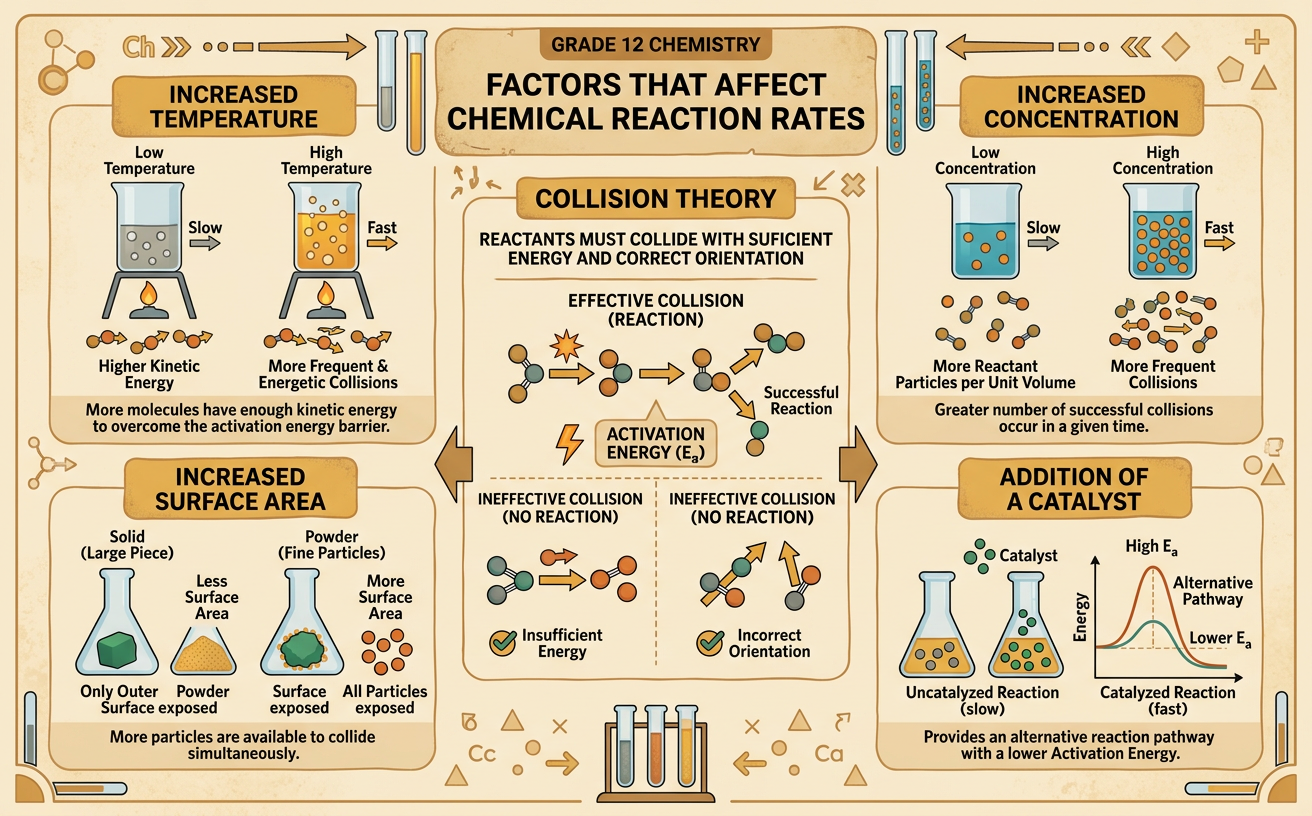
Students use collision theory and experimental evidence to explain how temperature, concentration, surface area, and catalysts affect chemical reaction rates.
Illustrations are auto-generated and may be placeholders. They can be refreshed to match the narration.
Defining Reaction Rate
Chemical reaction rate describes how quickly reactants are consumed or products are formed. It is measured as a change in concentration divided by a change in time. For a reactant, the concentration decreases, so a negative sign is often used to report a positive rate. For a product, the concentration increases. Common units are moles per liter per second, written as mol/L·s. Suppose hydrogen peroxide concentration falls from 0.80 mol/L to 0.50 mol/L in 30 seconds. Its average disappearance rate is −(0.50 − 0.80)/30, or 0.010 mol/L·s. Reaction rates are not always constant. A reaction is often fastest near the beginning because reactant concentrations are highest, then slows as reactants are used. Rate measurements allow chemists to compare reaction conditions and control processes such as food preservation, medicine production, and fuel combustion.

Collision Theory
Collision theory explains reaction rate by examining particle interactions. Reactant particles must collide before their atoms can rearrange into products, but not every collision causes a reaction. An effective collision must have enough kinetic energy to overcome the activation energy barrier and, for many reactions, the particles must also meet with a suitable orientation. For example, nitrogen monoxide can react with ozone to form nitrogen dioxide and oxygen. A collision is effective only if the interacting parts of the molecules approach in a way that allows old bonds to break and new bonds to form. Reaction conditions change the number or effectiveness of collisions. Increasing the frequency of collisions can increase rate, while increasing particle energy can raise the fraction of collisions that overcome activation energy. Collision theory therefore connects particle-level behavior to rates measured in the laboratory.

Effects of Temperature and Concentration
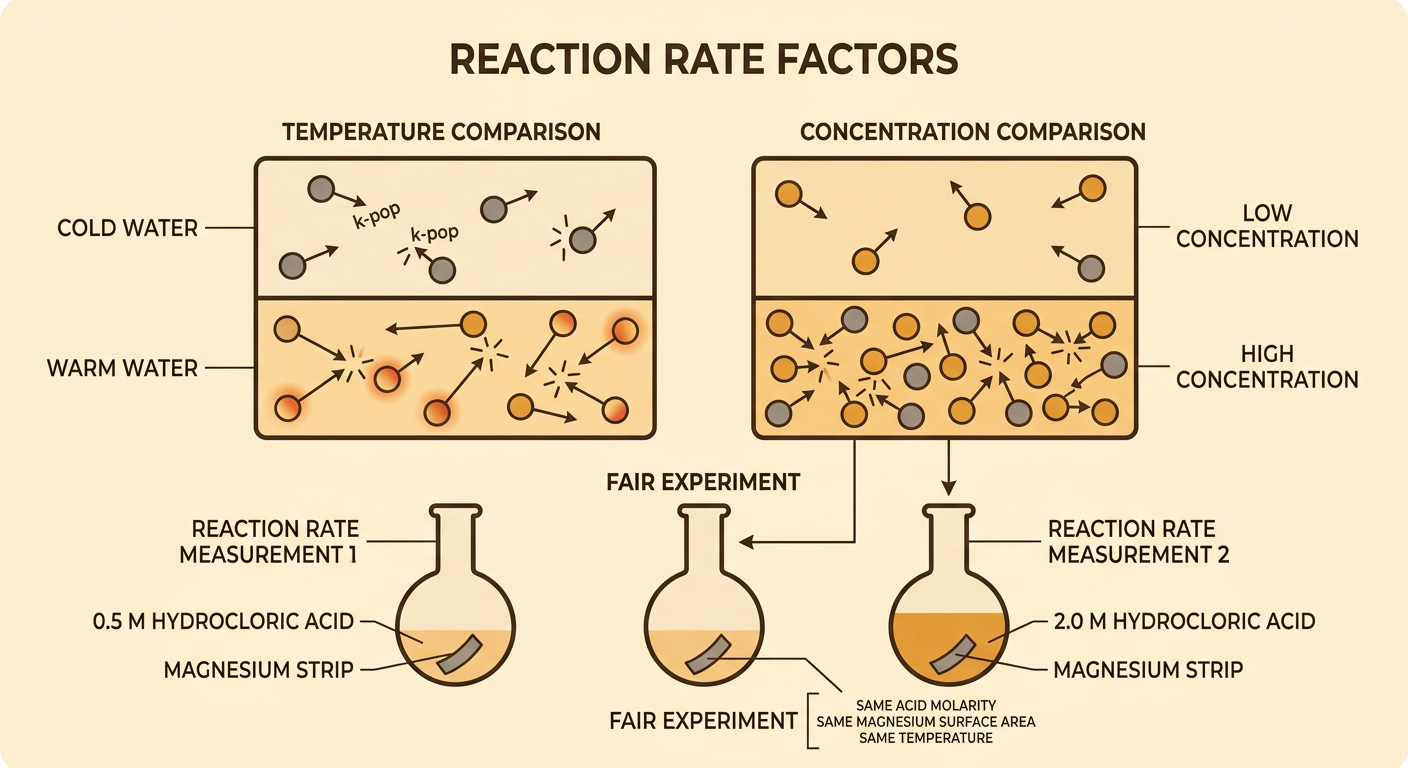
Increasing temperature usually increases reaction rate because particles move faster and collide more frequently. More importantly, a larger fraction of collisions has enough energy to overcome the activation energy. For example, an effervescent tablet reacts faster in warm water than in cold water. Increasing reactant concentration also usually raises the rate because more particles occupy the same volume, making collisions more frequent. If hydrochloric acid at 2.0 mol/L reacts with magnesium faster than acid at 0.5 mol/L under otherwise identical conditions, the greater concentration is the likely cause. Temperature and concentration affect rate in different particle-level ways: temperature changes the distribution of particle energies, while concentration changes the number of particles per volume. A fair experiment changes only one factor at a time and controls variables such as reactant amount, surface area, pressure, and mixing.
Surface Area and Catalysts
Surface area affects the rate of reactions involving a solid because only exposed particles can collide with another reactant. Crushing a solid increases its surface-area-to-volume ratio and exposes more particles. For example, powdered calcium carbonate reacts with hydrochloric acid faster than an equal mass of large calcium carbonate chips. A catalyst increases reaction rate through a different mechanism. It provides an alternative reaction pathway with lower activation energy, so a larger fraction of collisions can be effective at the same temperature. Catalysts participate in intermediate steps but are regenerated and are not consumed overall. Catalase, an enzyme found in many living cells, speeds the decomposition of hydrogen peroxide into water and oxygen. A catalyst does not change the overall energy difference between reactants and products or the equilibrium composition. It helps the system reach equilibrium faster in both directions.

Interpreting Rate Data
Rate data are often displayed in tables or concentration-versus-time graphs. The average rate over an interval equals the change in concentration divided by elapsed time, which corresponds to the slope between two points. A steeper slope has a greater rate magnitude. The instantaneous rate at one moment is represented by the slope of a tangent line. Suppose product concentration rises from 0.00 mol/L at 0 seconds to 0.24 mol/L at 20 seconds, then to 0.32 mol/L at 40 seconds. The average formation rate is 0.012 mol/L·s during the first interval but only 0.0040 mol/L·s during the second. The decreasing slope shows that the reaction is slowing. A graph may eventually level off because a limiting reactant has been depleted or equilibrium has been reached. When comparing trials, students should examine initial slopes, units, controlled variables, trends, and measurement uncertainty.

Evidence-Based Explanation
A strong scientific explanation combines a claim, relevant evidence, and reasoning based on collision theory. Consider four trials measuring the time needed to produce 50 mL of carbon dioxide from calcium carbonate and hydrochloric acid. Large chips in 1.0 mol/L acid take 80 seconds, powdered solid in 1.0 mol/L acid takes 35 seconds, and powdered solid in 2.0 mol/L acid takes 18 seconds. The evidence supports the claim that greater surface area and concentration increase the reaction rate because the same product volume forms in less time. Collision theory provides the reasoning: powder exposes more solid particles, and concentrated acid supplies more reacting particles per volume, increasing collision frequency. Evidence also informs decisions. An industrial process might use a catalyst to achieve a useful rate at a lower temperature, reducing energy costs, but decision makers must also consider catalyst price, toxicity, durability, and waste.
