Feedback Loops: Maintaining Blood Glucose Homeostasis
Students analyze blood glucose data, model insulin and glucagon feedback loops, and use biological evidence to evaluate a proposed diabetes-prevention policy.
Illustrations are auto-generated and may be placeholders. They can be refreshed to match the narration.
Homeostasis and Dynamic Equilibrium
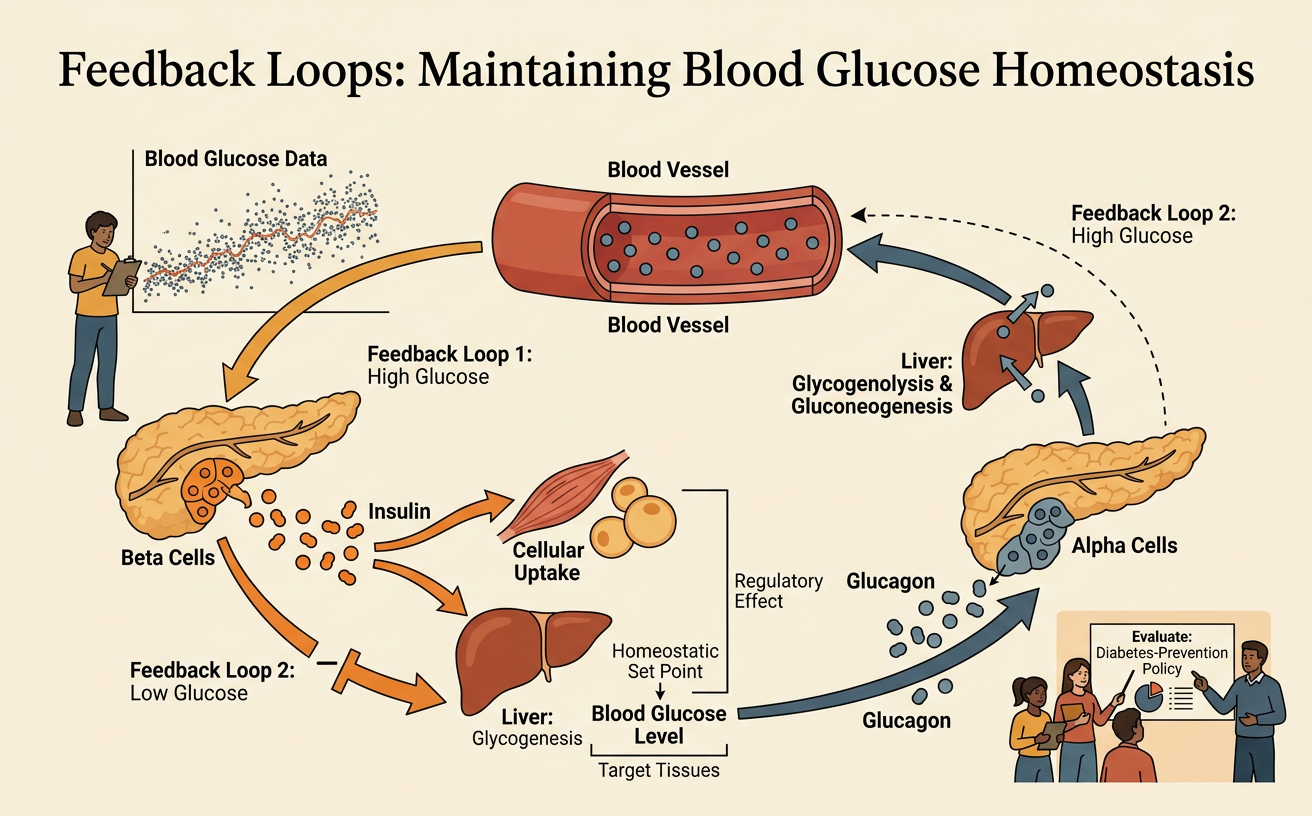
Homeostasis is the maintenance of internal conditions within ranges that support cell function. It does not mean that conditions remain perfectly constant. Instead, variables such as blood glucose fluctuate around a typical range as the body responds to meals, exercise, and fasting. This pattern is called dynamic equilibrium. In a negative feedback loop, a change away from a set range activates responses that counteract the change. For example, blood glucose normally rises after a carbohydrate-rich meal. The pancreas detects the increase and releases insulin, which helps lower blood glucose toward its earlier level. During an overnight fast, blood glucose may fall, causing the pancreas to release glucagon. Glucagon helps raise blood glucose. Together, these opposing responses provide evidence that feedback mechanisms maintain a stable internal environment despite changing external conditions.

Reading Blood Glucose Data
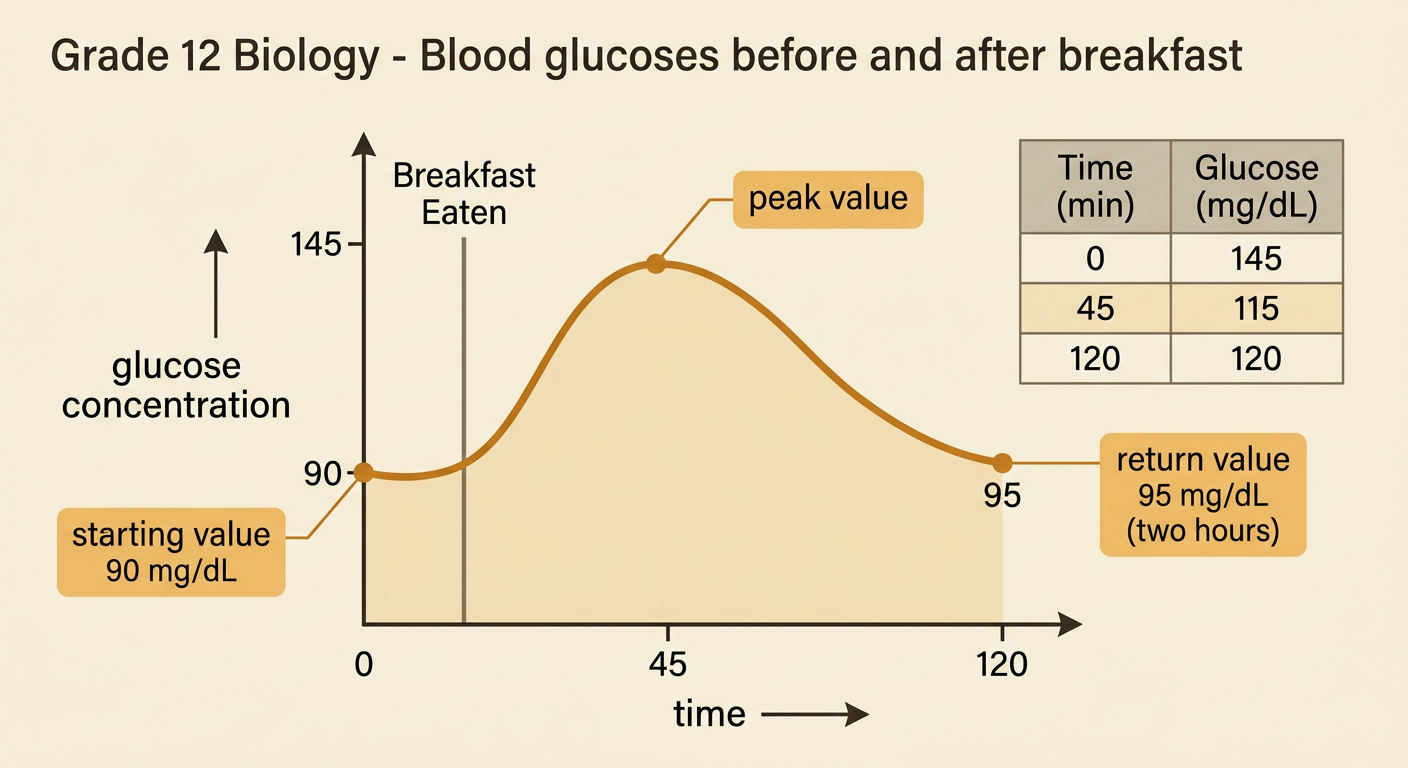
A blood glucose graph usually places time on the horizontal axis and glucose concentration, commonly measured in milligrams per deciliter, on the vertical axis. To analyze the data, identify the starting value, maximum or minimum value, direction of change, and time required to return near the starting level. Suppose a person's glucose is 90 mg/dL before breakfast, rises to 145 mg/dL 45 minutes after eating, and returns to 95 mg/dL after two hours. The rise is associated with digestion and glucose absorption, while the later decline is consistent with insulin action. Compare multiple data sources before drawing conclusions. A graph may show the pattern, a data table may provide exact measurements, and a description of meal timing may explain why the pattern occurred. One measurement alone cannot establish whether feedback is functioning normally.
Modeling Insulin and Glucagon
A useful model identifies the stimulus, sensor, control signal, target tissues, response, and reduction of the original stimulus. When blood glucose rises, beta cells in the pancreas release insulin. Insulin promotes glucose uptake in skeletal muscle and adipose tissue and encourages the liver and muscles to store glucose as glycogen. These actions lower blood glucose, reducing the signal for insulin release. When blood glucose falls, alpha cells in the pancreas release glucagon. Glucagon mainly acts on the liver, stimulating glycogen breakdown and the production and release of glucose. Blood glucose then rises, reducing the signal for glucagon release. For example, insulin activity is more prominent after a meal, while glucagon activity becomes more prominent between meals. These are coordinated negative feedback loops, not simple on-and-off switches, and other hormones can also influence glucose regulation.

Predicting Feedback Disruptions
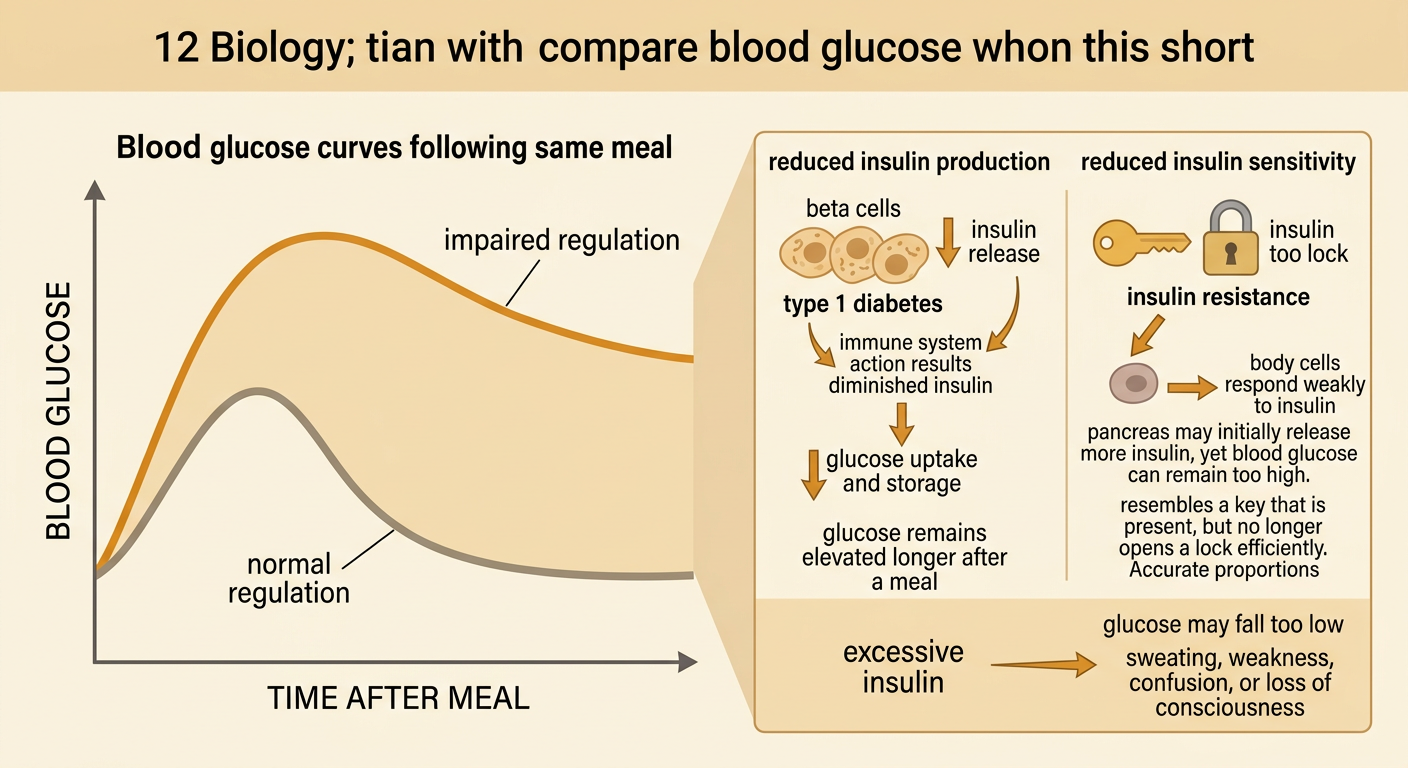
A feedback model can be tested by changing one component and predicting effects throughout the system. If pancreatic beta cells produce too little insulin, glucose uptake and storage decrease, so blood glucose remains elevated longer after a meal. This occurs in type 1 diabetes because the immune system destroys beta cells. If body cells respond weakly to insulin, the pancreas may initially release more insulin, but glucose can still remain too high. This insulin resistance is a major feature of type 2 diabetes. A different disruption, excessive insulin, can drive blood glucose too low, causing sweating, confusion, weakness, or loss of consciousness. Consider a graph in which two people begin at similar levels after eating. If one person's glucose stays elevated for several hours, the pattern suggests impaired regulation, but it does not identify the cause by itself. Additional measurements, including insulin levels and repeated clinical tests, are needed.
Evaluating a Public Health Policy
Public policies can address diabetes risk by changing environmental conditions, access to resources, or consumer information. Consider a proposed policy that places a tax on sugar-sweetened beverages and uses the revenue to fund free drinking-water stations and nutrition programs. Biological evidence supports the claim that frequent intake of high-sugar drinks can produce rapid glucose loads and add excess calories, which may contribute to weight gain and increased type 2 diabetes risk. However, evaluating the policy also requires population data, economic evidence, and perspectives from affected communities. Students should ask whether beverage purchases and diabetes-related outcomes change, whether benefits and costs are distributed fairly, and whether people have affordable alternatives. Supporters may emphasize prevention and public costs, while critics may challenge effectiveness, fairness, or government authority. A strong evaluation distinguishes evidence from opinion and proposes measurable criteria for revising the policy.

Evidence-Based Exit Response
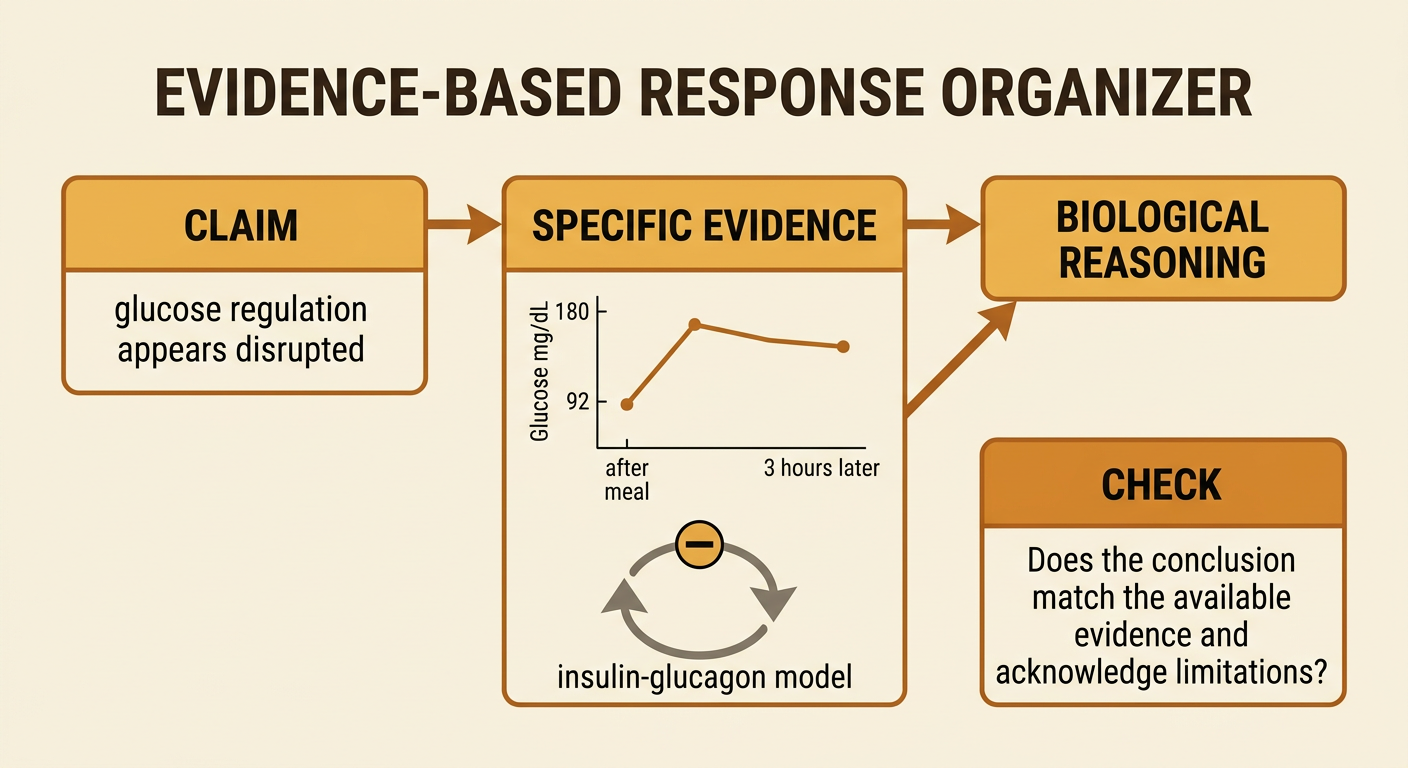
An evidence-based response should make a clear claim, cite specific evidence, and explain the biological reasoning that connects the evidence to the claim. Begin by answering whether the data show a working or disrupted negative feedback loop. Then use at least two forms of evidence, such as a glucose graph and an insulin-glucagon model. For example: The subject's glucose regulation appears disrupted because glucose rose from 92 to 180 mg/dL after a meal and remained above 160 mg/dL three hours later. In a typical negative feedback response, rising glucose stimulates insulin release, increasing cellular uptake and storage and moving glucose toward its earlier level. The sustained elevation suggests that insulin production or insulin responsiveness may be impaired. Avoid claiming a specific diagnosis unless the provided evidence supports it. If addressing policy, state one likely benefit, one limitation, and one measurable outcome that could test effectiveness.