
Finding Patterns with a Spreadsheet
Students organize, sort, and filter a small spreadsheet data set to identify patterns and support a conclusion with evidence.
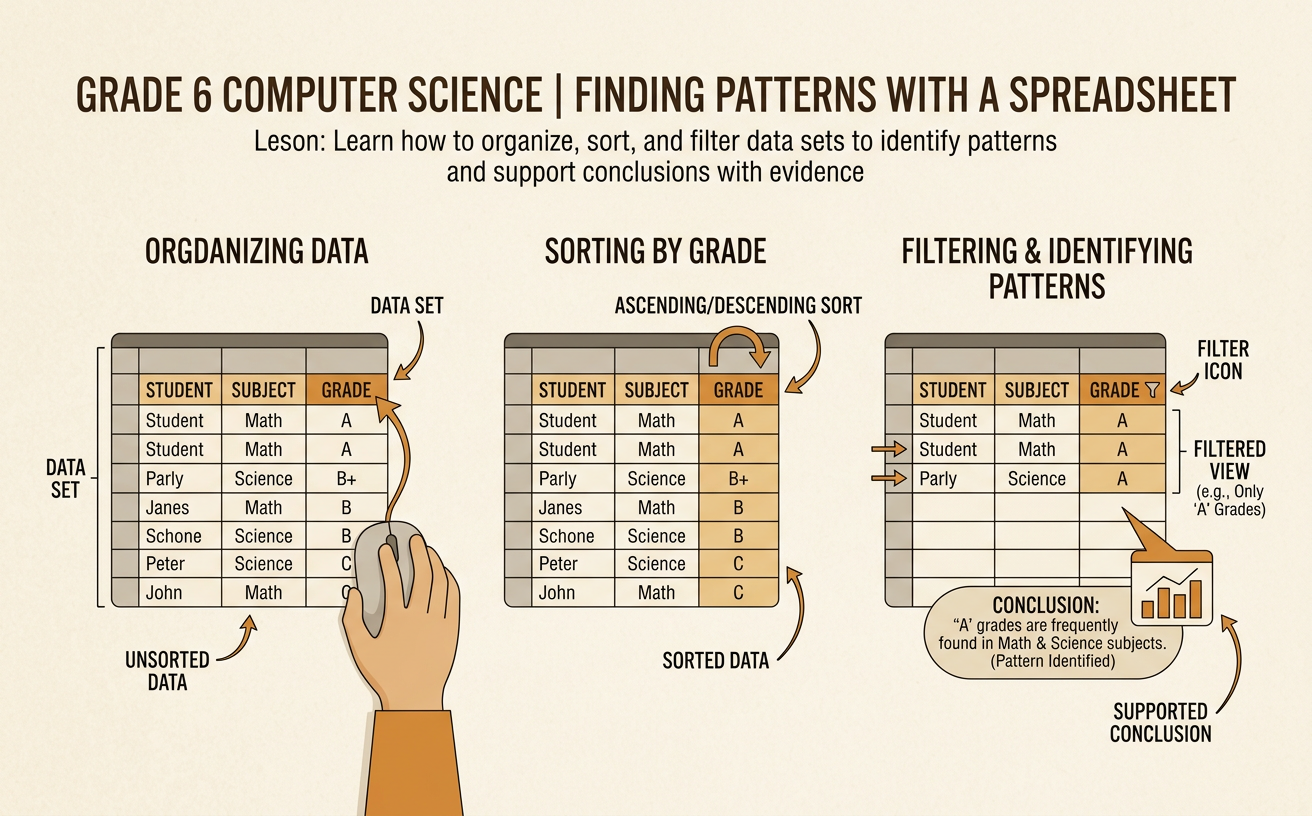
Illustrations are auto-generated and may be placeholders. They can be refreshed to match the narration.
Explore Rows, Columns, and Cells
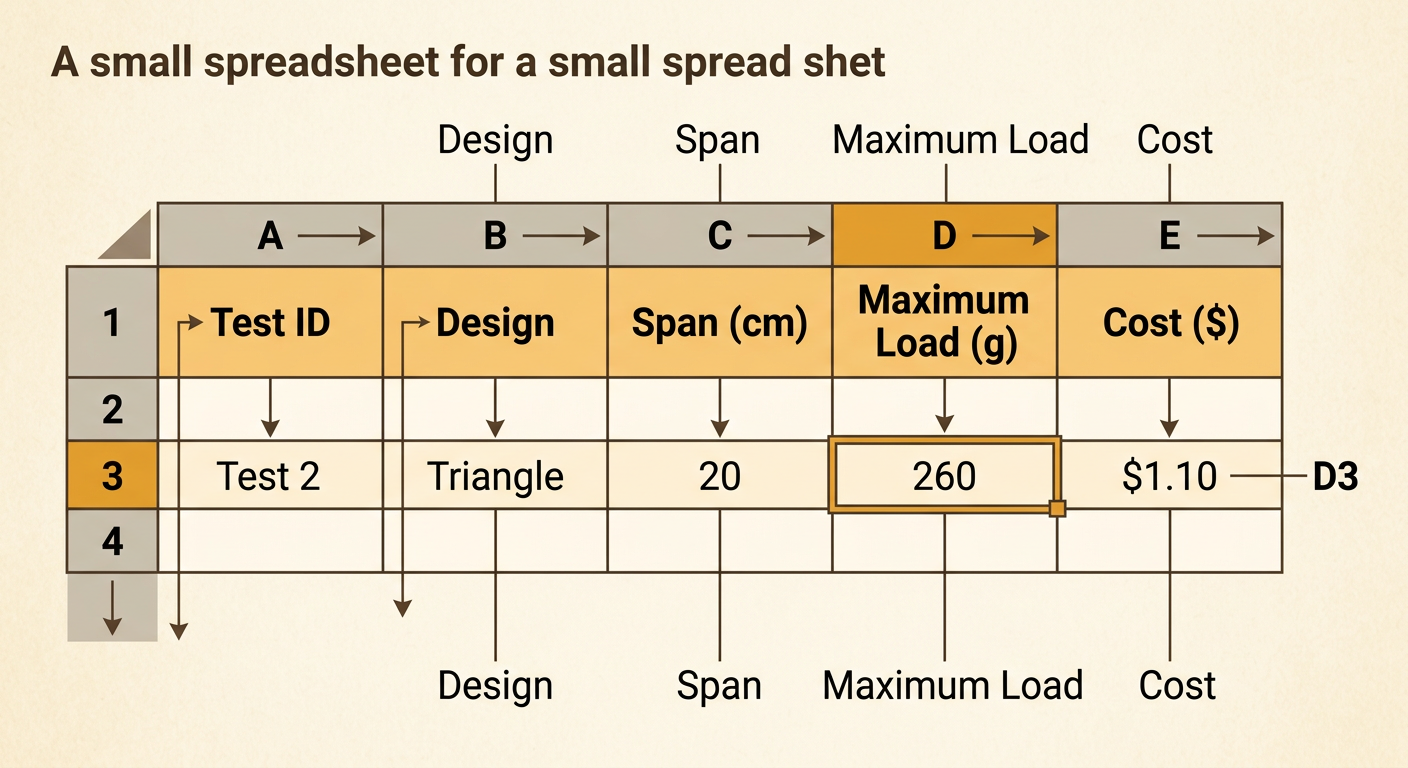
A spreadsheet organizes information in a grid. Each column contains one kind of information, such as bridge design, span, maximum load, or cost. Each row is one complete record from a bridge test. For example, row 3 might show Test 2, a triangle design, a 20-centimeter span, a maximum load of 260 grams, and a cost of $1.10. A cell is one box where a row and column meet. Cell D3 contains 260 because column D records maximum load and row 3 records Test 2. Clear headings and complete rows make the data easier to understand. Before analyzing a spreadsheet, check what each row represents and whether every column has a useful heading.
Recognize Data Types
Spreadsheet values have different data types. Text values are words or labels, such as “Triangle” in the Design column. Numerical values are quantities that can be measured or calculated, such as 20 centimeters or 260 grams. Currency is numerical data displayed with a dollar sign, such as $1.10. A Test ID may contain a number, but it works as a label rather than a measured quantity. Data types matter because spreadsheet tools treat them differently. You can calculate the mean of maximum loads, but finding the mean of design names would not make sense. Check that each column uses one consistent type. If one load is entered as “two hundred grams” instead of 200, the spreadsheet may treat it as text and leave it out of a calculation.

Sort the Data
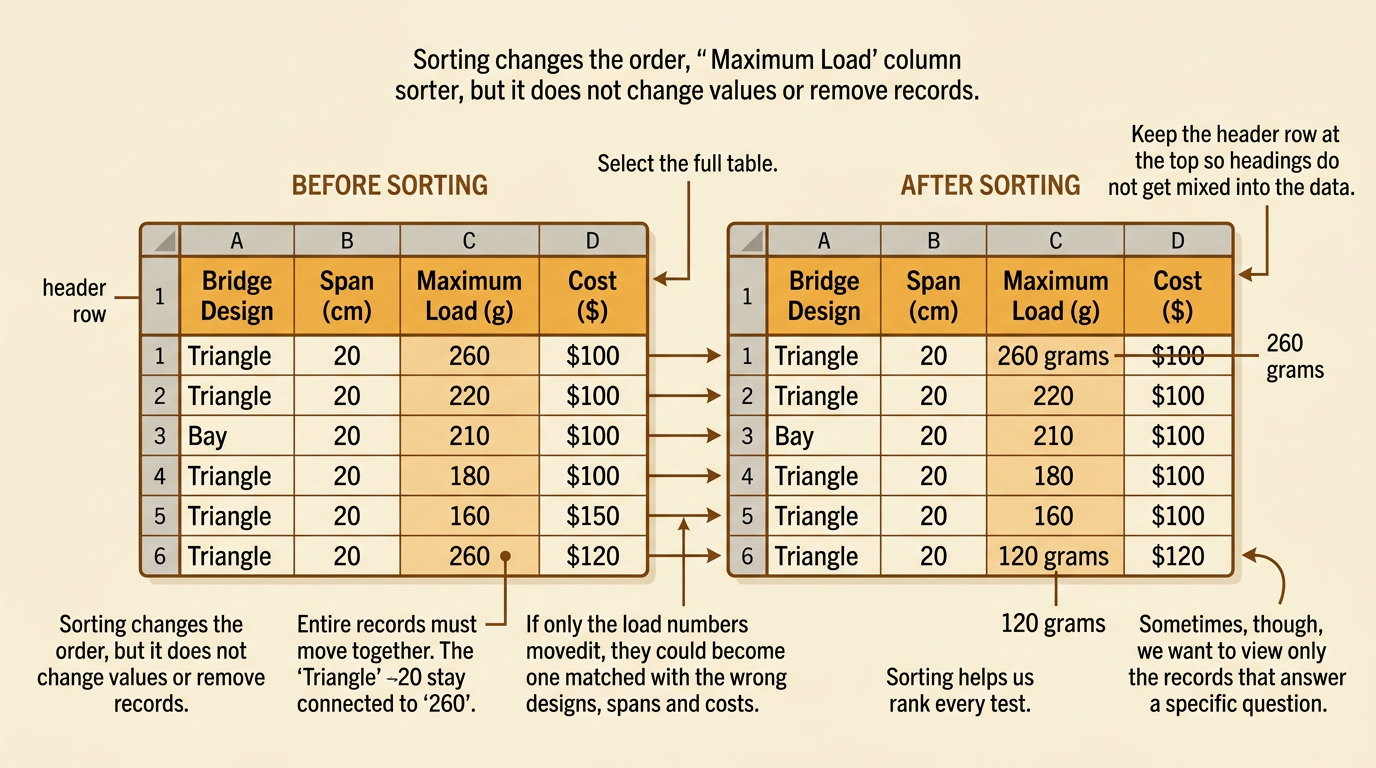
Sorting rearranges entire rows according to the values in one column. Suppose six bridge tests have maximum loads of 180, 260, 220, 120, 210, and 160 grams. Sorting the Maximum Load column from largest to smallest places 260 first, followed by 220, 210, 180, 160, and 120. This quickly shows which test held the most weight. The whole row must move together so that each load remains connected to the correct design, span, and cost. After sorting, the triangle design with a 20-centimeter span is still paired with its 260-gram load. Sorting does not remove records or change values; it only changes their order. Always select the full data table and keep the header row at the top.
Filter for Relevant Records
Filtering temporarily displays only records that meet a condition. Imagine that you want to compare bridge designs tested across a 30-centimeter span. Set a filter on the Span column to show only rows where the value equals 30. The visible records are a beam holding 120 grams, a triangle holding 210 grams, and an arch holding 160 grams. The other rows are hidden, not deleted. This filter makes the comparison fairer because all three visible bridges crossed the same distance. Choose filter conditions that match your question. Filtering by color or by an unrelated detail would not provide useful evidence. Also check the source of the information. Results recorded during controlled class tests are more relevant to this question than claims from an advertisement designed to sell building materials.

Identify a Pattern
A pattern is a repeated relationship or noticeable trend in the data. After grouping the six bridge tests by design, calculate the mean maximum load for each design. The two triangle bridges held 260 and 210 grams, for a mean of 235 grams. The arch bridges held 220 and 160 grams, for a mean of 190 grams. The beam bridges held 180 and 120 grams, for a mean of 150 grams. In this data set, triangle designs had the highest mean load. The pattern also appears within both span groups: the triangle bridge held the most weight at 20 centimeters and at 30 centimeters. However, six tests are a small sample. The pattern describes these tests and does not prove that every triangle bridge will always be strongest.

Support a Conclusion with Evidence
A strong conclusion answers the question and cites specific, trustworthy evidence. One supported conclusion is: “In these six class tests, the triangle design was the strongest overall.” The evidence is that triangle bridges had the highest mean maximum load, 235 grams, compared with 190 grams for arches and 150 grams for beams. At the 30-centimeter span, the triangle also held 210 grams, more than the arch at 160 grams and the beam at 120 grams. Explain the limits of the evidence too. Only two bridges of each design were tested, and the triangle bridges cost more than the beam bridges. The class test records are relevant because they directly measure bridge performance. They are more credible if students used the same materials, loading method, measuring tools, and recording rules for every test.
