
Forces, Mass, and Changes in Motion
Students analyze evidence from a cart investigation to explain how an object's mass and the strength of an applied force affect its change in motion.

Illustrations are auto-generated and may be placeholders. They can be refreshed to match the narration.
Review Force and Motion
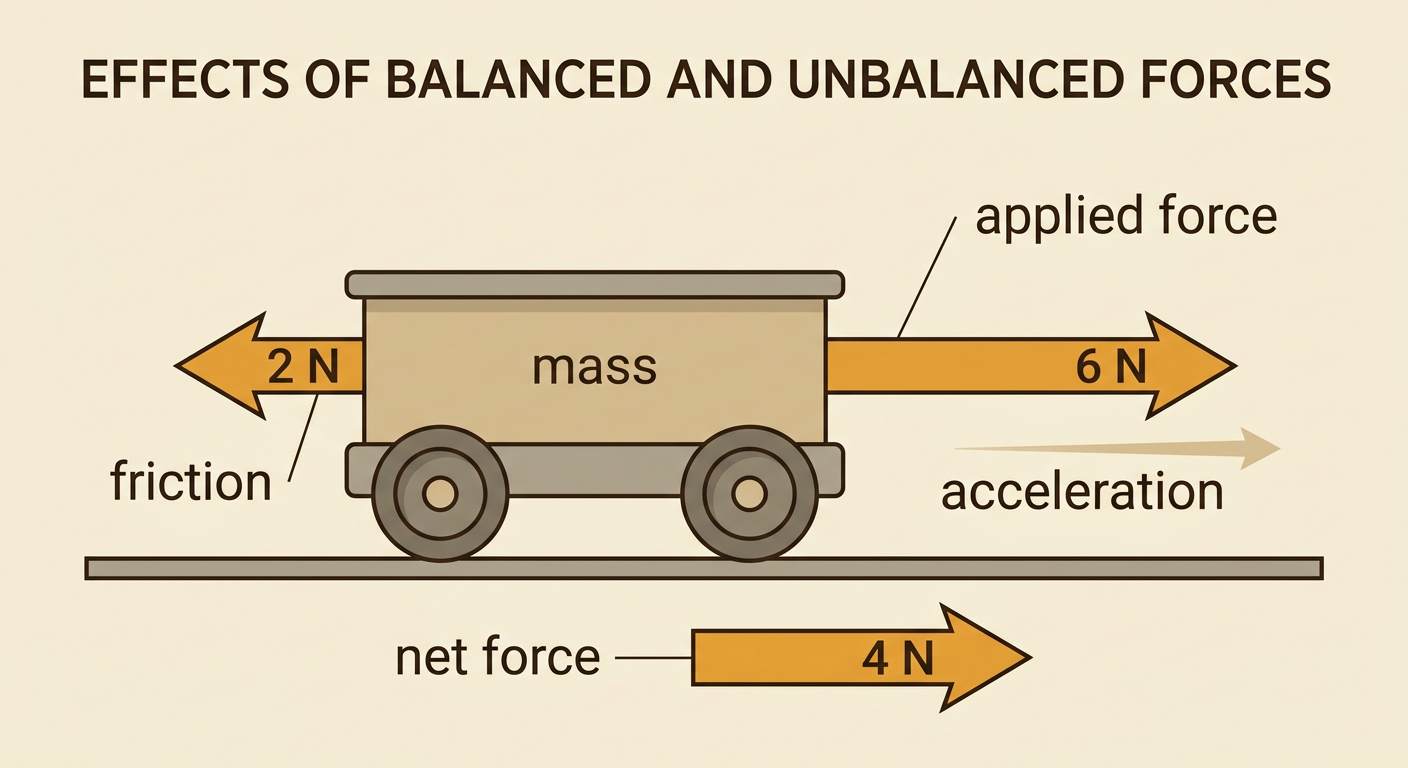
A force is a push or pull measured in newtons. Forces have both strength and direction. To find the net force on an object, combine all the forces acting on it, paying attention to direction. Balanced forces produce a net force of zero, so they do not change an object’s motion. Unbalanced forces cause acceleration, which means a change in speed, direction, or both. For example, imagine pushing a cart to the right with 6 newtons while friction pulls left with 2 newtons. The net force is 4 newtons to the right, so the cart accelerates right. Mass also matters. If the same net force acts on two carts, the cart with less mass has a greater change in motion than the heavier cart.
Predict the Cart's Motion
Before testing, make predictions that connect force, mass, and change in motion. First, keep the cart’s mass constant and change only the applied force. A stronger net force should produce a greater increase in speed during the same amount of time. Next, keep the applied force constant and add masses to the cart. The cart with greater total mass should have a smaller increase in speed. For example, predict what will happen when a 1-kilogram cart and a 2-kilogram cart are each pulled with the same net force. The 1-kilogram cart should accelerate more. Record each prediction before collecting data. Clearly identify the independent variable you change, the dependent variable you measure, and the controlled variables, such as track length, starting position, and test time.

Test Force and Mass
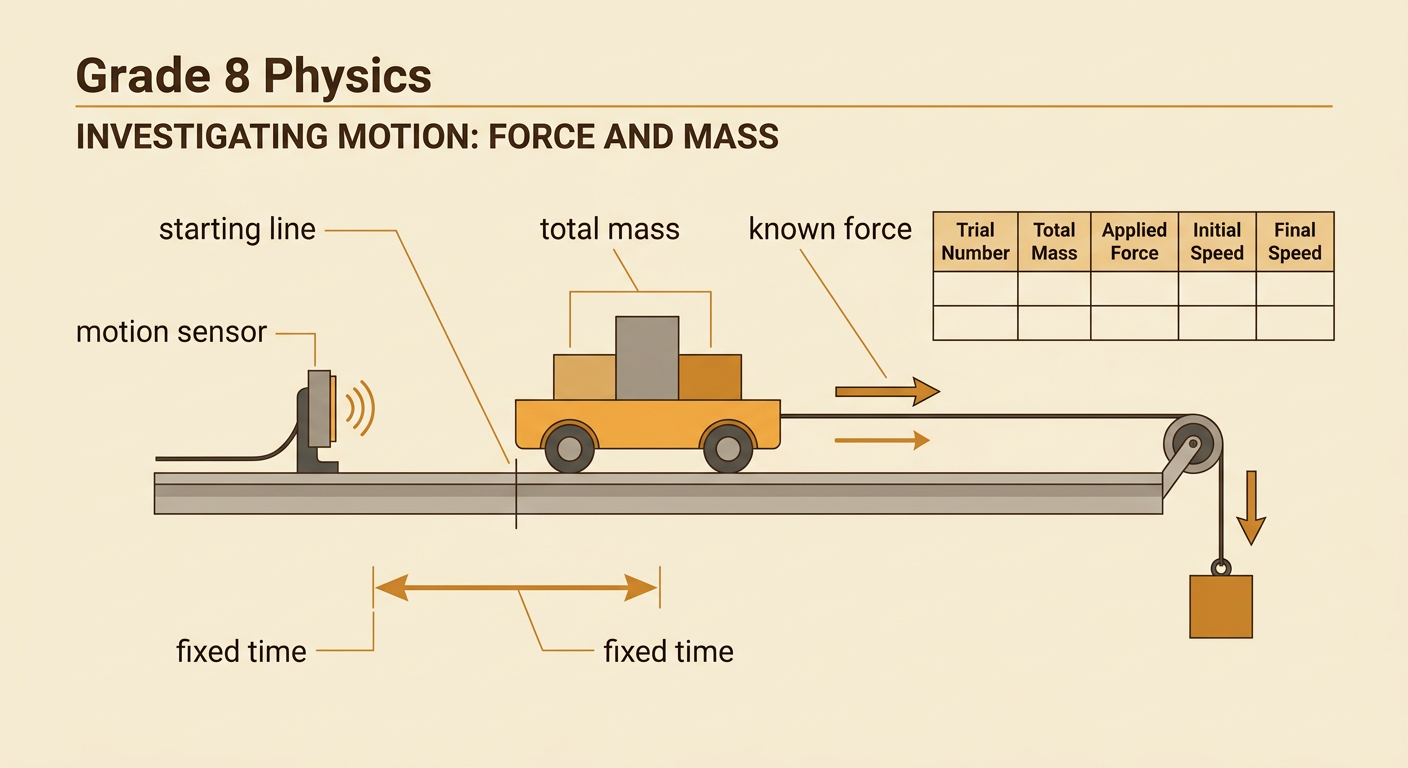
Follow the same multistep procedure for every trial. Place the cart at a marked starting line on a level track. Measure the cart’s total mass, including any added blocks. Apply a known force with a hanging mass, spring scale, or calibrated fan, and use a motion sensor to record the cart’s speed for a fixed time. Repeat each condition at least three times and calculate an average. In one set of trials, keep mass constant while changing the force. In another set, keep force constant while changing the mass. For example, test a 1-kilogram cart with net forces of 1, 2, and 3 newtons. Then use a 2-newton force on carts with total masses of 1, 2, and 3 kilograms. Release the cart without giving it an extra push.
Graph and Compare Results
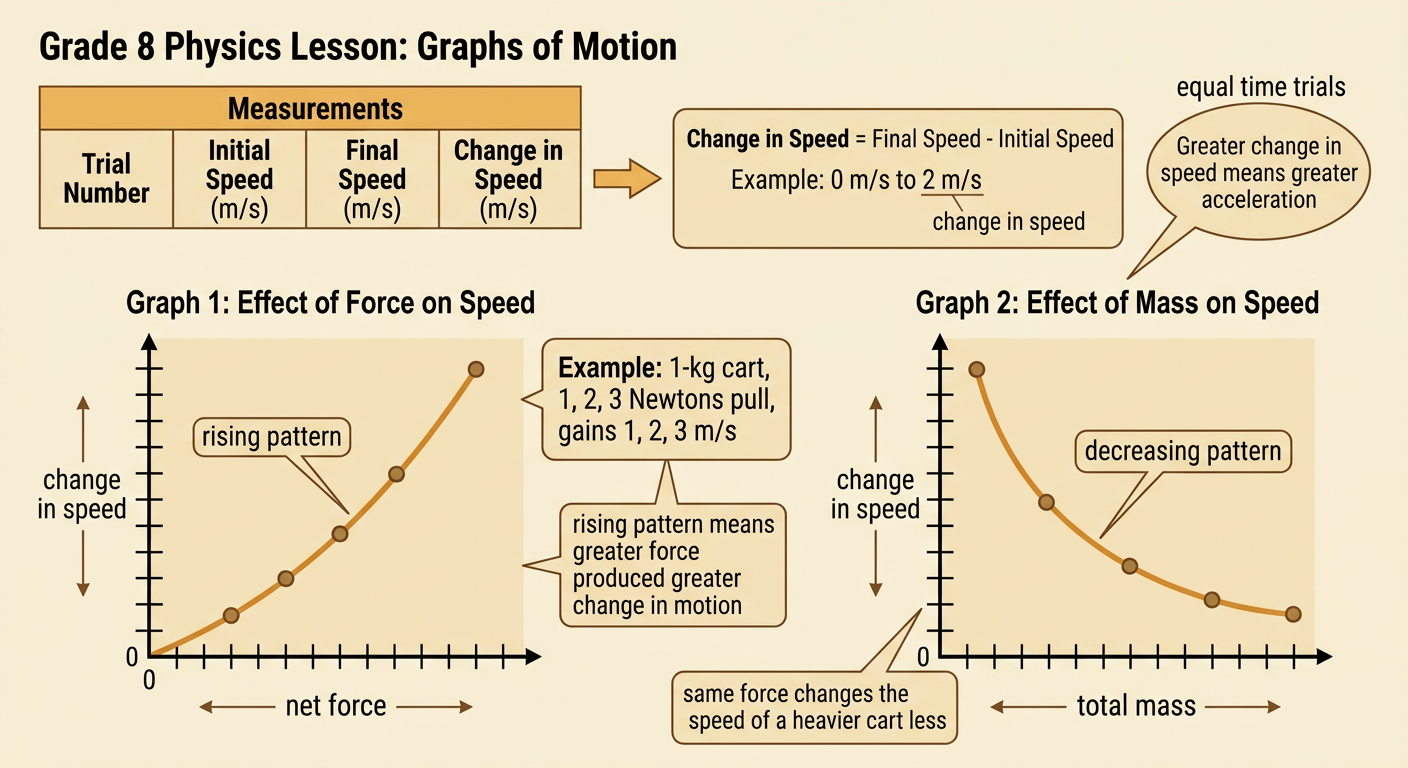
Organize the measurements in a table, then calculate change in speed by subtracting initial speed from final speed. When the test time is the same, a greater change in speed indicates greater acceleration. Make one graph for force trials, with net force on the horizontal axis and change in speed on the vertical axis. A rising pattern shows that greater force causes a greater change in motion. For example, a 1-kilogram cart might gain 1, 2, and 3 meters per second when pulled by 1, 2, and 3 newtons for equal times. Make a second graph for mass trials. With the same force, the graph should decrease as mass increases. Describe each graph’s overall pattern, compare data points, and note any result that does not fit the pattern.
Explain the Evidence
Use a claim, evidence, and reasoning structure to explain the investigation. A strong claim is that an object’s change in motion increases when the net force increases and decreases when the object’s mass increases. Support the claim with specific measurements or graph patterns. For example, if doubling the force on the same cart doubled its change in speed, cite those values as evidence. Then explain that net force causes acceleration, while greater mass makes an object resist changes in motion. This relationship helps engineers design transportation systems. A loaded truck needs more force and a longer distance to speed up or stop than a bicycle. Highways, bridges, warehouses, and transit routes are arranged partly around how vehicles carry people and goods. As transportation technology changes, travel times and patterns of movement between places can also change.
