
Friction: How Different Surfaces Slow Motion
Students roll a toy car across different surfaces, measure its travel distance, and use evidence to explain how friction affects motion.
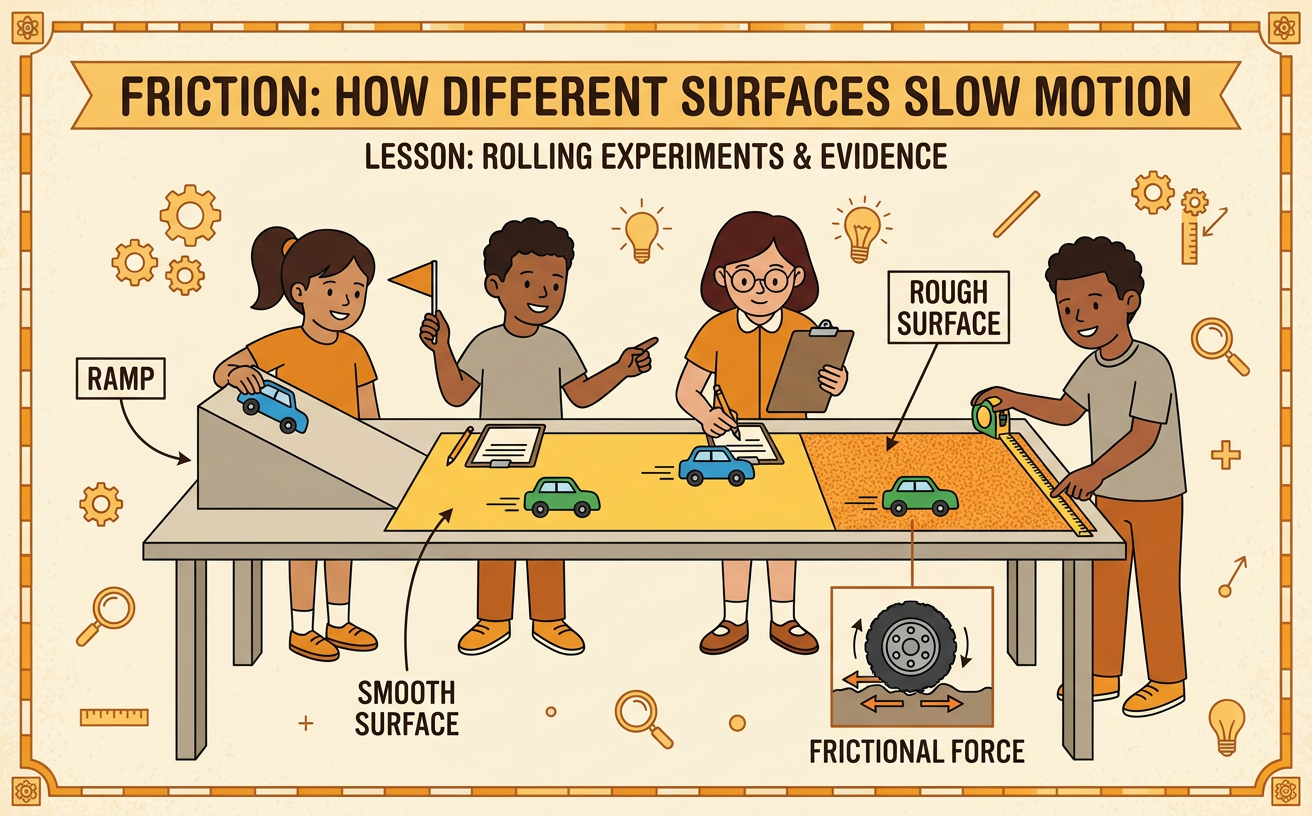
Illustrations are auto-generated and may be placeholders. They can be refreshed to match the narration.
What Is Friction?
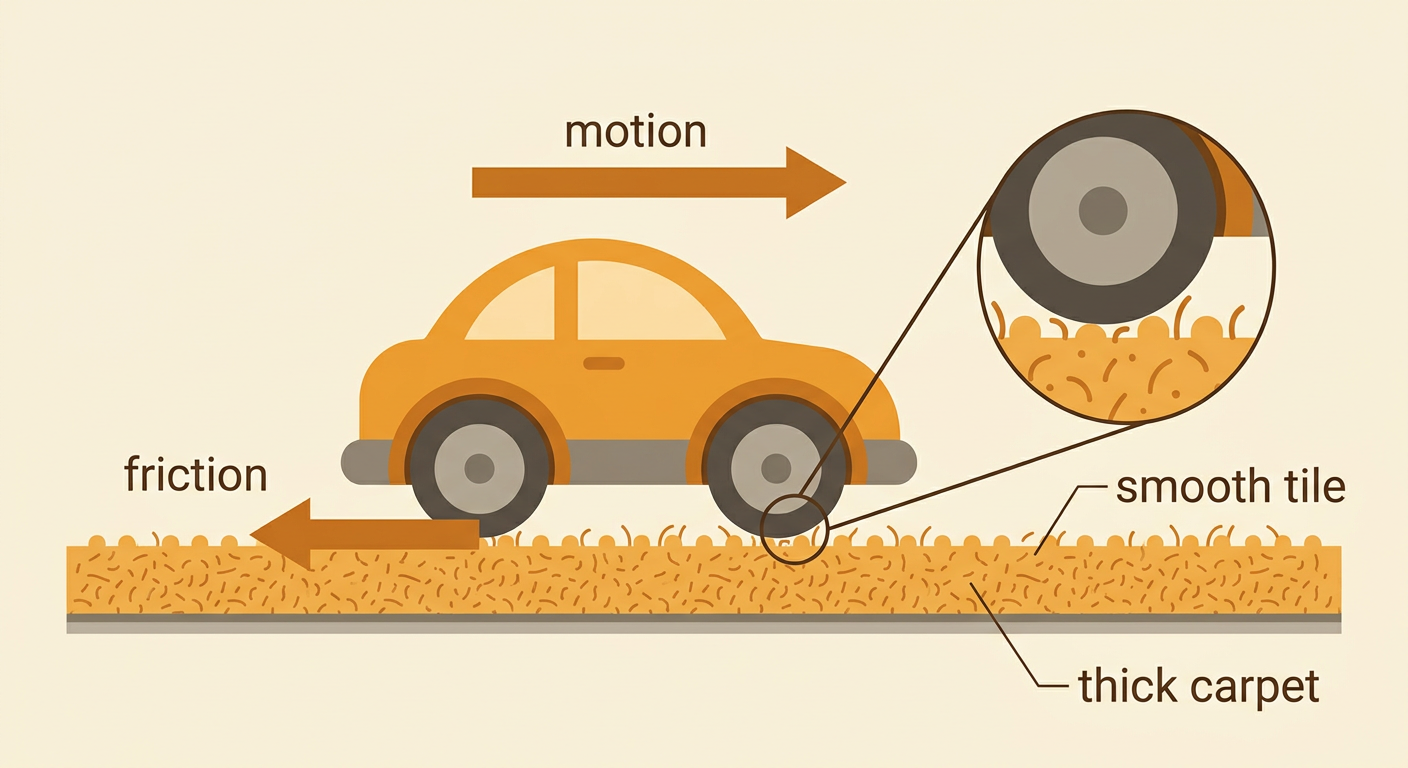
Friction is a force that acts when two surfaces touch. It works against motion, so it can slow or stop a moving object. When a toy car rolls forward, friction acts where its wheels touch the floor. Friction also occurs inside the turning wheels and between the car and the air. Different surfaces can create different amounts of friction. For example, a car may roll a long distance across smooth tile but stop sooner on thick carpet. The carpet presses and bends against the wheels, making it harder for them to keep rolling. Friction is useful, too. It helps your shoes grip the ground so you do not slide. In this investigation, the distance a car travels will provide evidence about how strongly each surface slows its motion.
Predicting Surface Effects
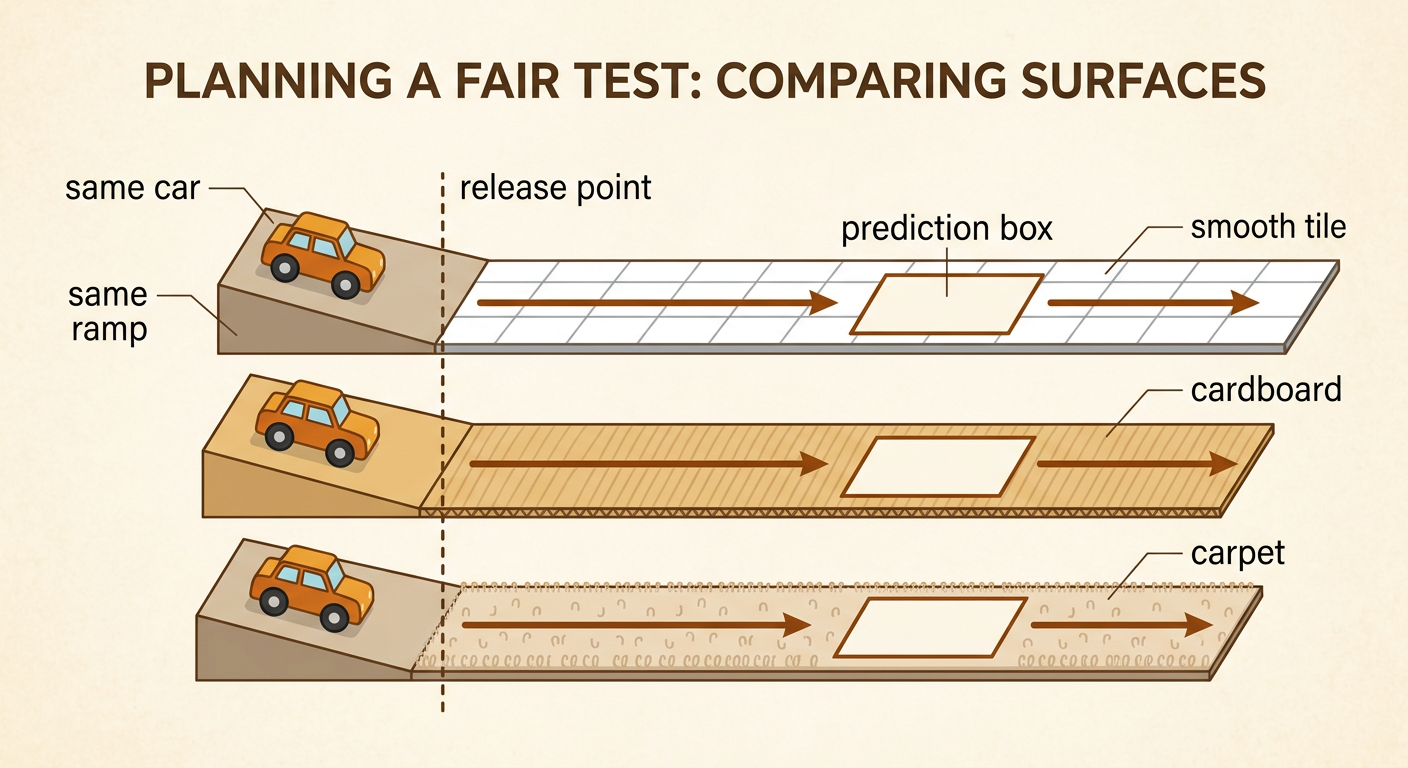
Before testing, predict how far the toy car will travel on each surface. A prediction is a statement about what you think will happen based on what you already know. Look at and gently feel surfaces such as smooth tile, cardboard, and carpet. You might predict that the car will travel farthest on tile and the shortest distance on carpet. Explain your thinking: “I predict that the car will stop sooner on carpet because the carpet is rough and soft, so it will resist the wheels.” A prediction does not have to be correct. The investigation will provide evidence to support or change it. Identify what will change and what will stay the same. Change only the surface. Keep the same car, ramp, release point, starting line, and measuring method for every test.
Testing a Toy Car
Plan a fair test so that the surface is the only factor that changes. Attach one test surface to the floor so it lies flat. Place a small ramp at the starting line and mark one release point near the top. Set the same toy car at that point and let it go without pushing. When the car stops, mark the location of its front axle. Test the surface at least three times because one trial may be unusual. Then repeat the procedure with each other surface. Reset the car, ramp, and measuring tools in the same positions every time. For example, if the car bumps a table leg during one trial, do not use that result; clear the lane and repeat the trial. Record careful observations, such as whether the car rolled smoothly, bounced, or turned.

Measuring Travel Distances
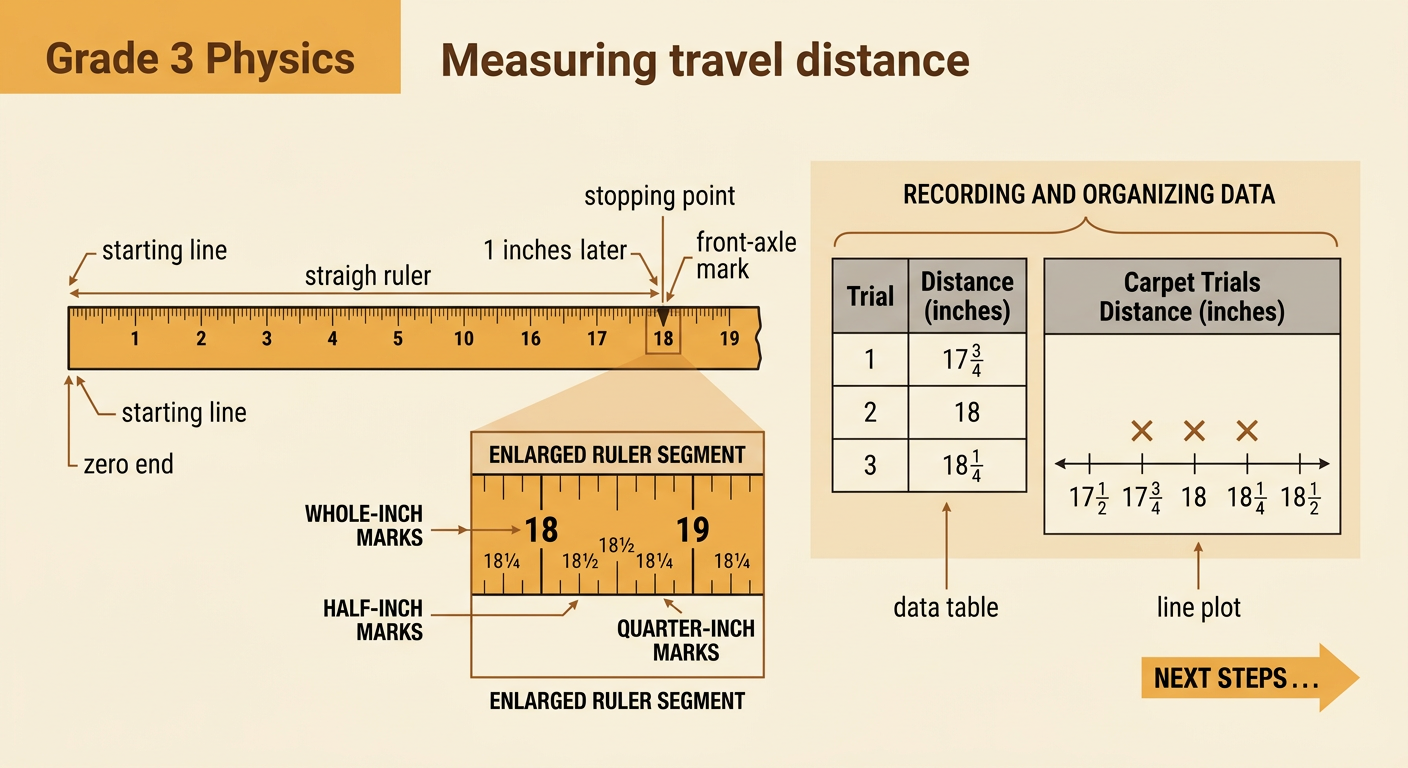
Measure the car’s travel distance from the starting line to the marked stopping point. Place the zero end of a ruler or measuring tape exactly at the starting line. Keep the tool straight and read the number at the front-axle mark. Record each length to the nearest quarter inch if your ruler has quarter-inch marks. Do not begin at the physical edge of a ruler unless that edge is labeled zero. Suppose the carpet trials measure 17 3/4 inches, 18 inches, and 18 1/4 inches. Record all three results instead of choosing only one. You can organize the measurements in a data table and make a line plot. On the line plot, place an X above the correct distance for every trial. Repeated X marks show distances that occurred more than once.
Comparing the Results
Use the data table and line plot to compare how far the car traveled on each surface. Look for a pattern across all the trials, not just one measurement. Imagine that the tile distances are about 42 inches, the cardboard distances are about 30 inches, and the carpet distances are about 18 inches. The car traveled farthest on tile and the shortest distance on carpet. Because the same car began each trial in the same way, the distance pattern is evidence that the surfaces slowed the car differently. A shorter travel distance shows a greater slowing effect. Also notice how spread out the measurements are. Results that are close together make the pattern more dependable. If one result is very different, check your notes for a bump, crooked path, measuring error, or other possible cause.

Making an Evidence-Based Claim
An evidence-based explanation includes a claim, evidence, and reasoning. The claim answers the investigation question. Evidence comes from measurements and observations. Reasoning explains how the evidence supports the claim. For example, write: “I claim that carpet slowed the toy car more than cardboard or tile. In three trials, the car traveled about 18 inches on carpet, 30 inches on cardboard, and 42 inches on tile. We also observed the wheels pressing into the carpet. Because every trial used the same car, ramp, and release point, the shorter carpet distances show that the carpet had a greater slowing effect.” Use more than one source of evidence, such as your data table, line plot, and observation notes. End by telling whether the evidence supported your original prediction or caused you to revise it.
