From Natural Resources to Synthetic Materials
Students analyze evidence about how synthetic materials are chemically produced from natural resources and compare their useful properties and societal impacts.
Illustrations are auto-generated and may be placeholders. They can be refreshed to match the narration.
Natural and Synthetic Materials
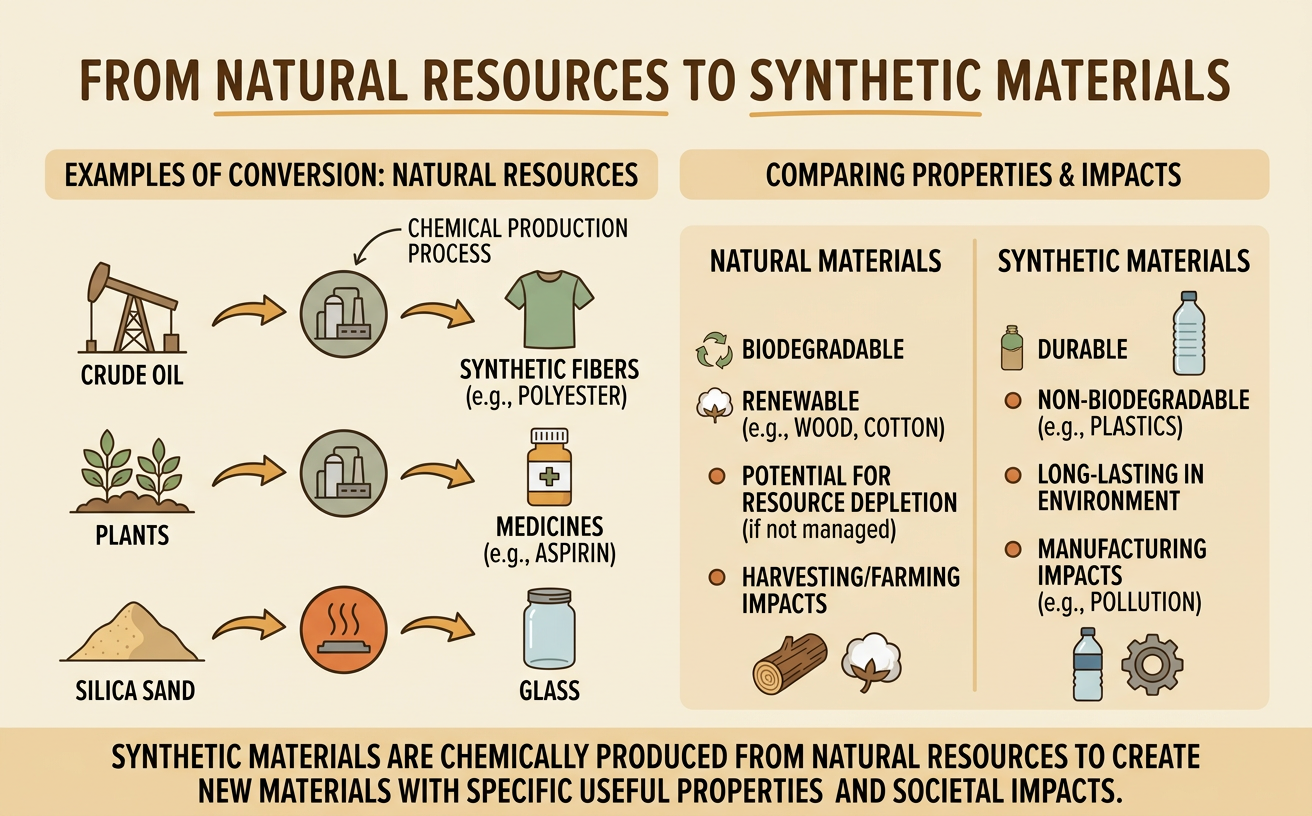
Natural materials come from plants, animals, rocks, or other parts of Earth. Wood, cotton, wool, and clay are examples. People may cut, clean, melt, or shape these materials without creating a completely different substance. Synthetic materials are made through chemical processes controlled by people. Their starting substances, however, still come from natural resources. For example, cotton fibers grow on plants, while polyester fibers are manufactured from chemicals commonly obtained from petroleum or natural gas. Both can be woven into fabric, but they have different properties. Cotton absorbs water well, while polyester dries quickly and resists wrinkles. The word synthetic does not automatically mean harmful or artificial in every way. It describes how a material is produced. Scientists examine a material’s source, manufacturing process, properties, uses, and effects on society.

Tracing a Material to Its Source
A material can be traced backward from a finished product to its original resources. Consider a clear plastic beverage bottle made from polyethylene terephthalate, or PET. Manufacturing begins with raw materials commonly obtained from crude oil or natural gas. These resources are separated and chemically processed to produce smaller molecules, including ethylene glycol and terephthalic acid. In a reaction called polymerization, these molecules join to form long PET molecules. The PET is cooled into pellets, melted, and shaped into bottles. Evidence for this pathway can come from product information, manufacturing diagrams, and reliable science texts. When reading, students should cite exact details, such as the names of the starting chemicals or the steps in production. A complete source chain includes extraction, chemical production, material formation, manufacturing, use, and disposal or recycling.

How Chemical Processes Change Materials
A chemical process changes starting substances, called reactants, into new substances, called products. The atoms remain present, but their bonds and arrangements change. For example, ethene is a small molecule that can be obtained from petroleum or natural gas processing. During polymerization, many ethene molecules connect into long chains of polyethylene. Polyethylene has properties that individual ethene molecules do not have: it is solid at room temperature, flexible, and useful for bags, containers, and tubing. This is different from a physical change. Melting polyethylene changes its shape and state, but it remains polyethylene. Polymerization creates a new material with a different molecular structure. A diagram or text can provide evidence of chemical change by showing new bonds, long molecular chains, changed properties, or energy used during production. Manufacturers control temperature, pressure, and catalysts to make the process efficient.

Comparing Properties and Uses
Engineers choose materials by comparing measurable properties with the needs of a product. Suppose sample data show that PET has a density of about 1.38 grams per cubic centimeter, while common soda-lime glass has a density near 2.5 grams per cubic centimeter. A lower density can help make a container lighter. In one bottle comparison, a 500-milliliter PET bottle might have a mass of about 20 grams, while a reusable glass bottle might have a mass near 200 grams. The exact masses depend on the design. PET is transparent, impact resistant, and easy to shape, but it can soften at lower temperatures than glass. Glass is rigid, handles higher temperatures, and can be reused many times, but it is heavier and can break. Quantitative data help engineers match properties to uses rather than declaring one material best in every situation.

Evaluating Benefits and Tradeoffs
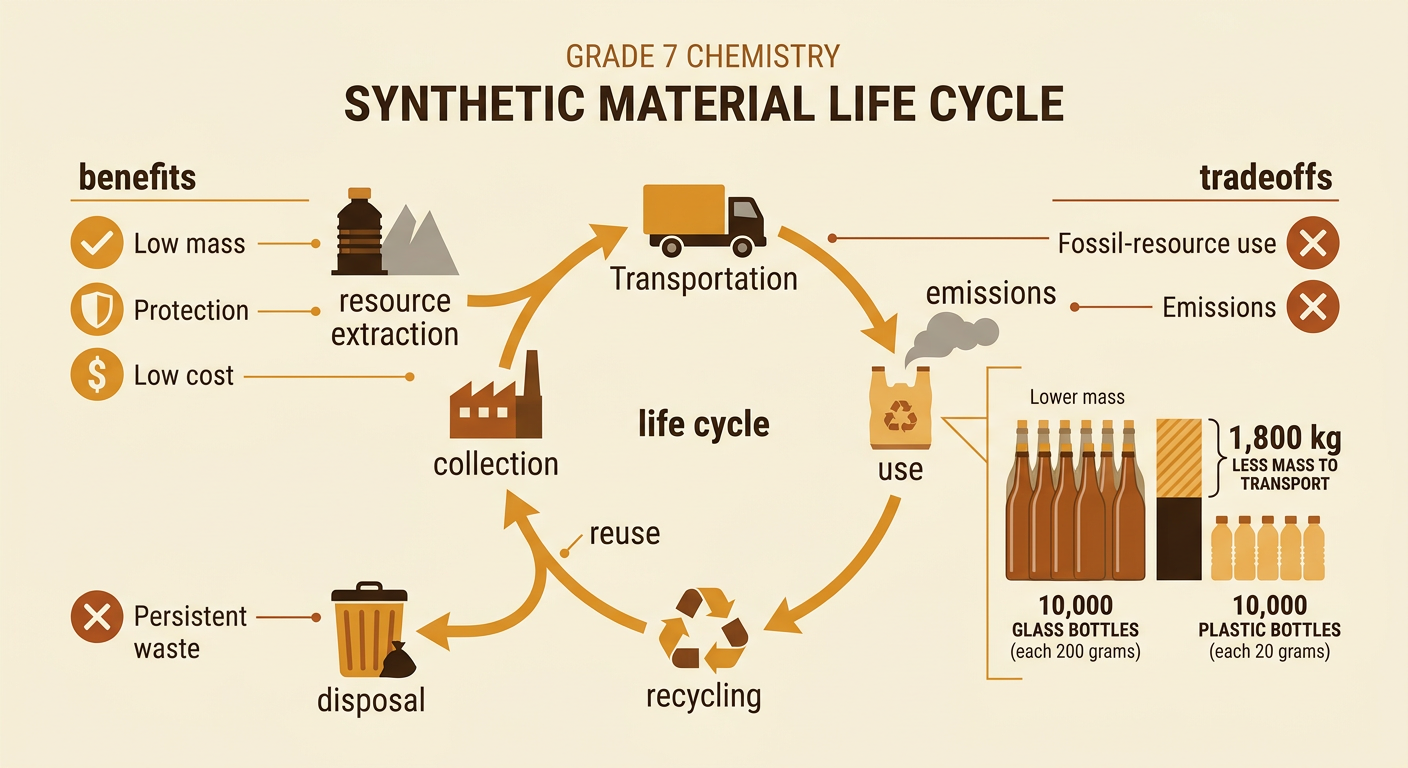
Synthetic materials can provide major benefits while also creating tradeoffs. Plastic packaging is lightweight, water resistant, inexpensive, and useful for protecting food and medicine. Lower mass may reduce transportation energy. For example, replacing 10,000 bottles that each weigh 200 grams with bottles that each weigh 20 grams reduces the transported container mass by 1,800 kilograms. However, producing many plastics uses fossil resources and energy, and discarded plastic can remain in the environment or break into small pieces. Recycling can reduce waste, but not every plastic item is collected or easily recycled. Economic choices also depend on resource availability. A region with petroleum processing plants may produce plastic cheaply, while a region with abundant sand, energy, and glass factories may favor glass. Decision makers should compare evidence about cost, performance, worker and consumer needs, emissions, reuse, recycling systems, and environmental effects across the material’s entire life cycle.