Graphing Linear Functions Using Slope and Intercept
Students graph linear functions from equations in slope-intercept form and explain how the slope and y-intercept determine each graph.
Illustrations are auto-generated and may be placeholders. They can be refreshed to match the narration.
Review Slope-Intercept Form
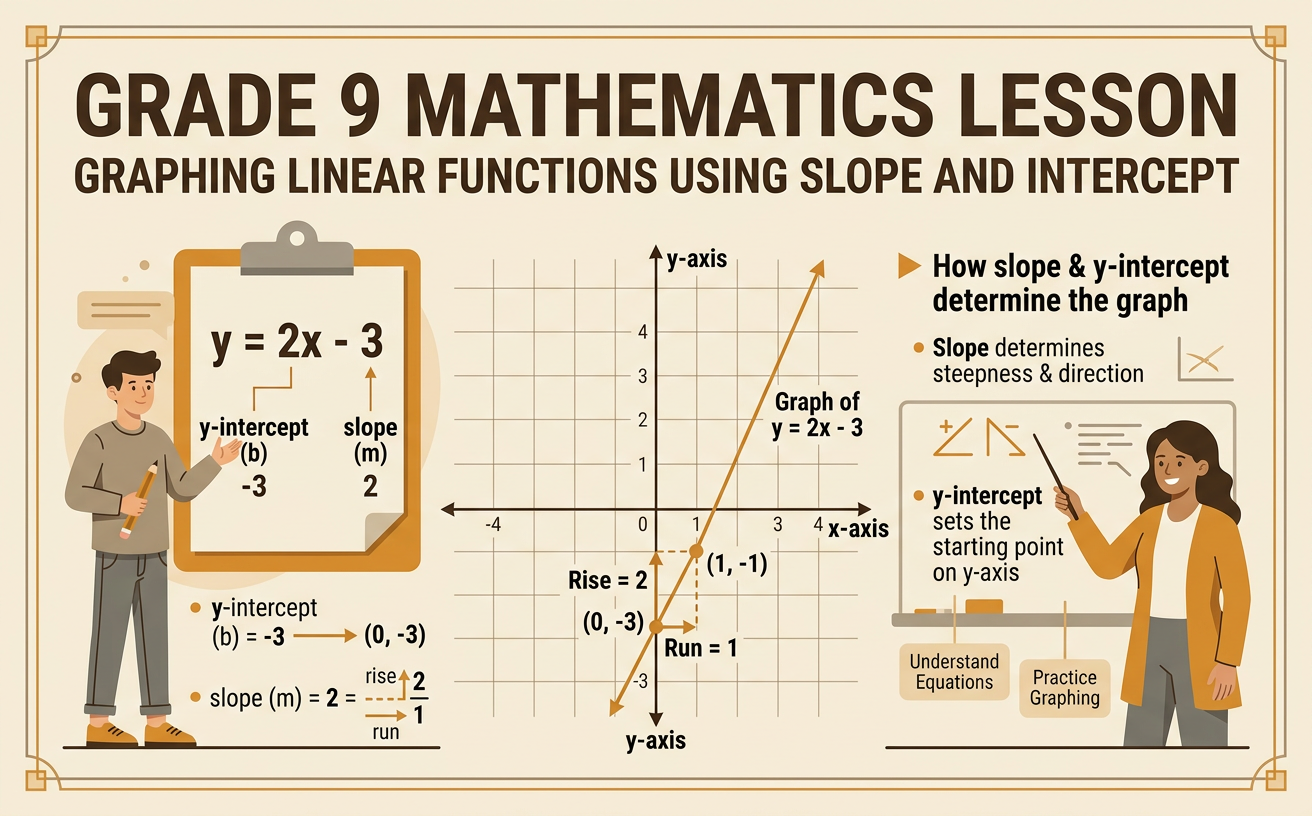
A linear function can often be written in slope-intercept form: y = mx + b. In this form, m represents the slope, and b represents the y-intercept. The slope describes the line’s rate of change, or how much y changes when x increases by 1. The y-intercept is the point where the line crosses the y-axis. For example, in y = 2x − 3, the slope is 2 and the y-intercept is −3. This means the line crosses the y-axis at (0, −3). A slope of 2 can be written as 2/1, so the graph rises 2 units for every 1 unit it moves to the right. Slope-intercept form gives you the two pieces of information needed to graph a linear function efficiently.

Identify the Slope and Y-Intercept
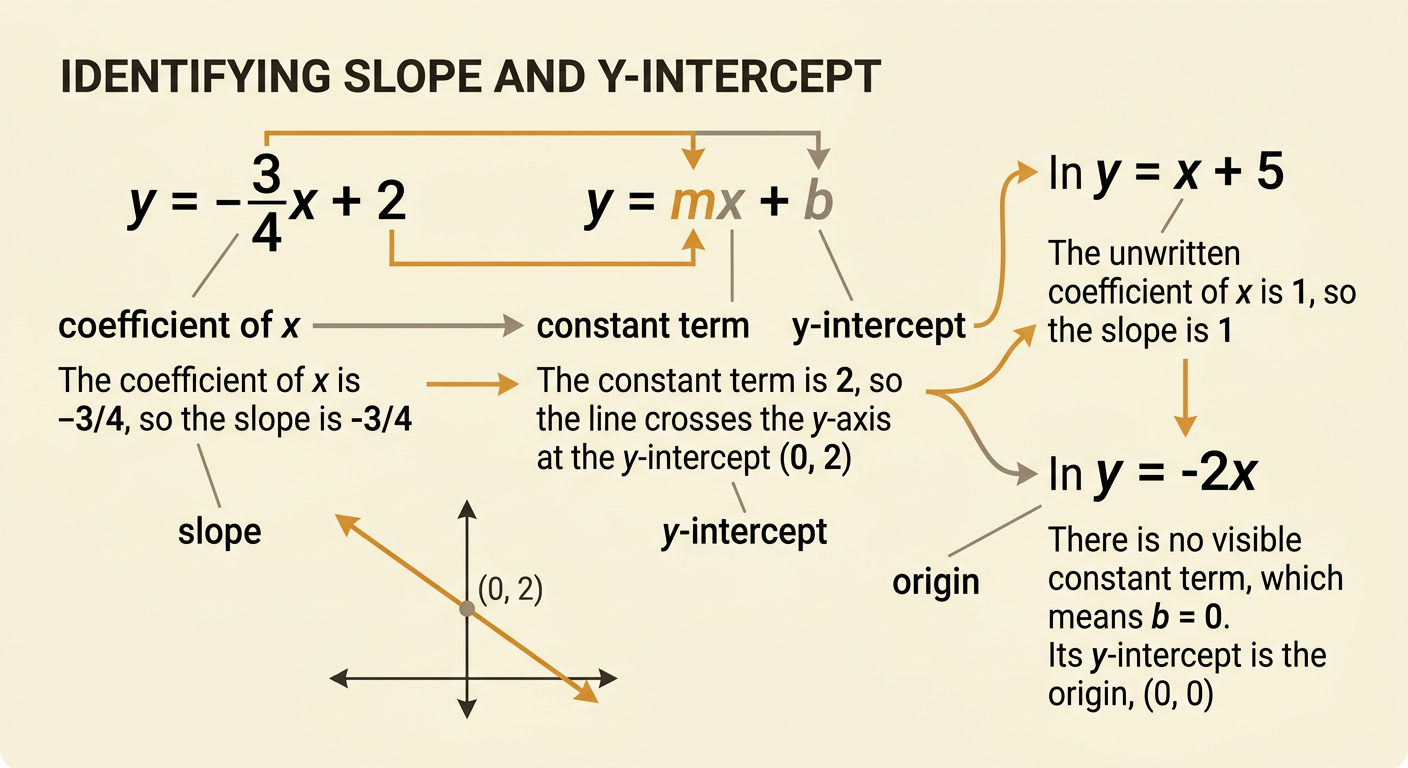
To identify the slope and y-intercept, compare an equation with y = mx + b. The coefficient of x is m, the slope, and the constant term is b, the y-intercept. Consider y = −3/4x + 2. The coefficient of x is −3/4, so m = −3/4. The constant term is 2, so b = 2, and the line crosses the y-axis at (0, 2). The negative slope tells you that the line falls from left to right. If an equation is written as y = x + 5, the unwritten coefficient of x is 1, so the slope is 1. If the equation is y = −2x, then b = 0, and the y-intercept is the origin, (0, 0).
Plot the Y-Intercept
Begin graphing a linear function by plotting its y-intercept. The y-intercept occurs where x = 0 because every point on the y-axis has an x-coordinate of 0. In y = 1/2x − 3, the constant term is −3, so b = −3. Write the intercept as the ordered pair (0, −3), then place a point three units below the origin on the y-axis. You can confirm the point by substituting x = 0 into the equation: y = 1/2(0) − 3 = −3. Therefore, (0, −3) is on the graph. Be careful not to plot (−3, 0); that point is on the x-axis and is not the y-intercept. Always write the y-intercept with 0 as its first coordinate.

Use Slope to Find More Points
After plotting the y-intercept, use the slope to locate more points. Write the slope as a fraction, m = rise/run, where rise is the vertical change and run is the horizontal change. For y = −2/3x + 1, begin at the y-intercept (0, 1). The slope −2/3 means move 3 units right and 2 units down. This reaches the point (3, −1). Repeat the same movement to reach (6, −3). You can also move in the opposite direction: go 3 units left and 2 units up from (0, 1) to reach (−3, 3). Each movement follows the same rate of change. A negative slope produces a line that falls as you move from left to right. Plot at least two points, although three points can help you notice an error.

Graph and Check the Linear Function
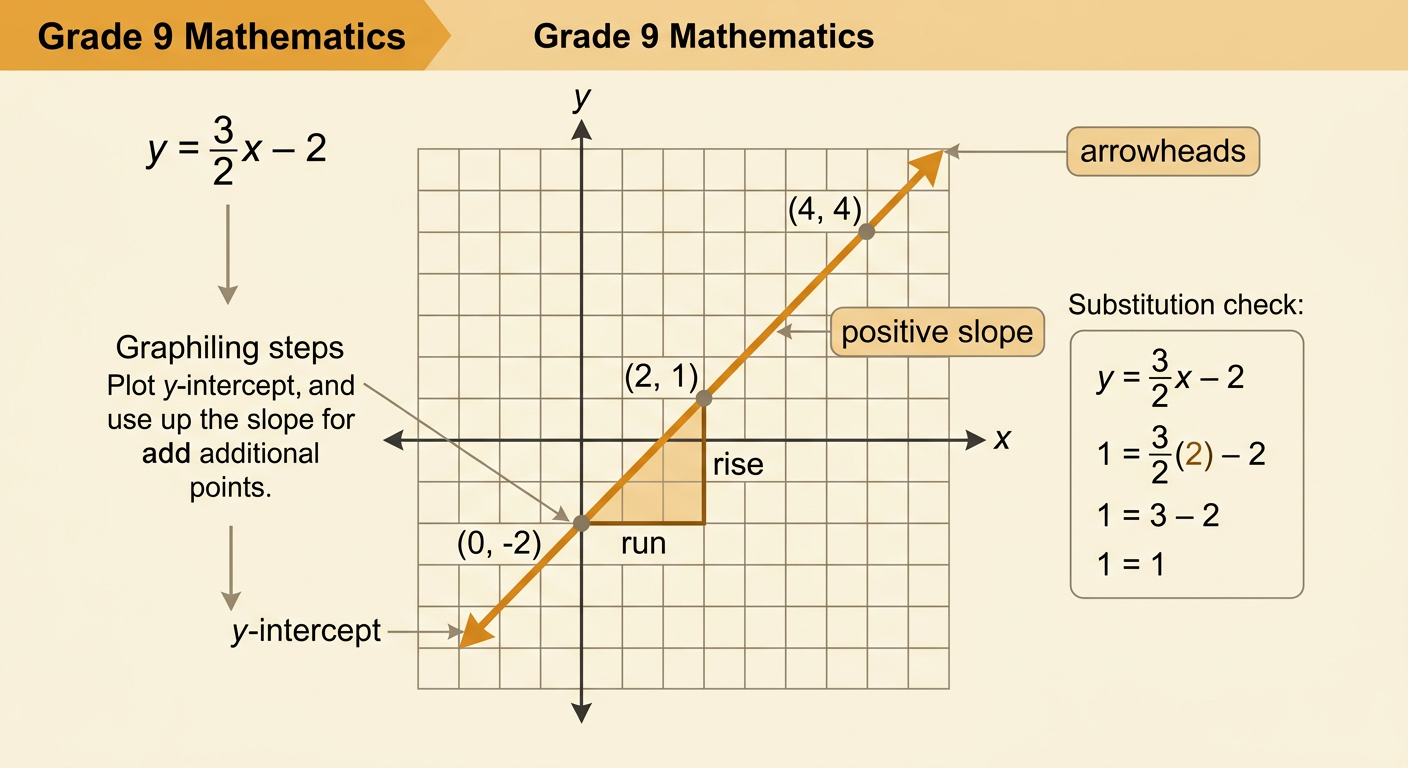
Once you have plotted the y-intercept and additional points, use a ruler or straightedge to draw one straight line through them. Extend the line in both directions and add arrowheads to show that it continues. For y = 3/2x − 2, first plot (0, −2). Then use the slope 3/2 to move 2 units right and 3 units up, reaching (2, 1), and repeat to reach (4, 4). Draw the line through all three points. Check the graph by substituting a plotted point into the equation. For (2, 1), calculate 3/2(2) − 2 = 3 − 2 = 1, so the point is correct. Also check that the line crosses the y-axis at −2 and rises from left to right because its slope is positive.