
Graphing Proportional Relationships
Students graph paired quantities, identify the origin and constant rate, and interpret points on a proportional relationship graph in context.
Illustrations are auto-generated and may be placeholders. They can be refreshed to match the narration.
Review Ordered Pairs and Axes
A coordinate plane has two number lines called axes. The horizontal line is the x-axis, and the vertical line is the y-axis. Their intersection is the origin, (0, 0). A point is named by an ordered pair, (x, y). The first coordinate tells how far to move horizontally, and the second tells how far to move vertically. Suppose a cyclist travels at a constant rate of 12 miles per hour. Time in hours belongs on the x-axis because it is the input. Distance in miles belongs on the y-axis because it depends on time. To plot (2, 24), begin at the origin, move right to 2 hours, and then move up to 24 miles. Labeling both axes and choosing equal intervals make the graph easy to read.
Create a Table of Proportional Values
A table can organize two quantities before you graph them. For a cyclist traveling 12 miles per hour, multiply each time by 12 to find the distance. The rule is y = 12x, where x is time in hours and y is distance in miles. At 0 hours, the cyclist has traveled 0 miles. At 1 hour, the distance is 12 miles; at 2 hours, it is 24 miles; and at 3 hours, it is 36 miles. The ratio y/x equals 12 for every row in which x is not zero. This unchanged ratio is the constant of proportionality, or unit rate. The row (0, 0) is also necessary because a proportional relationship begins with zero output when the input is zero.
Plot and Connect the Points
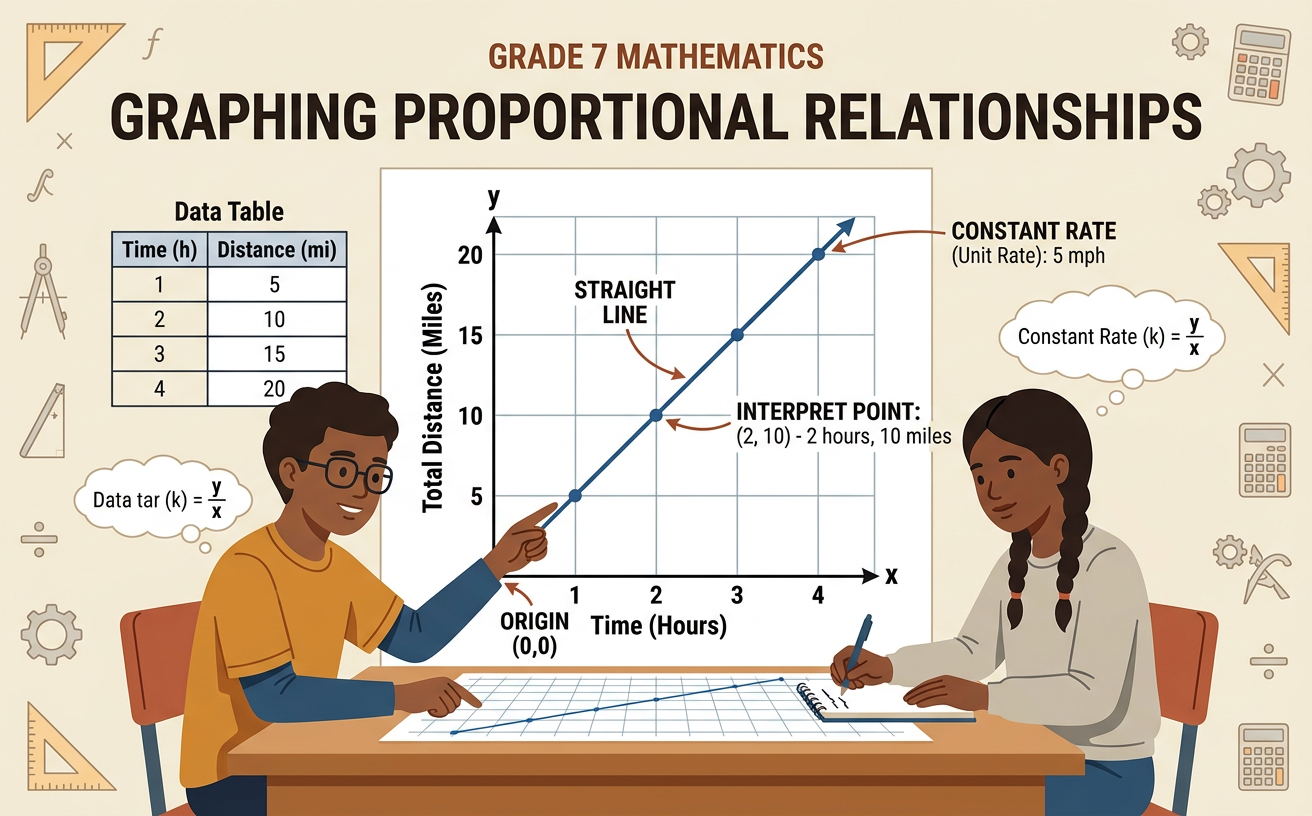
Turn each row of the table into an ordered pair: (0, 0), (1, 12), (2, 24), (3, 36), and (4, 48). Plot each point by moving horizontally to the time value and vertically to the distance value. Check the scale carefully because the axes use different units: the x-axis increases by 1 hour, while the y-axis increases by 12 miles. The points lie on one straight line. Because time and distance can include fractional values, draw a straight line through the points. For example, halfway between 1 and 2 hours is 1.5 hours, and the line shows a distance of 18 miles. A straight line indicates that the distance increases by the same amount during each equal time interval.
Interpret the Origin and Unit-Rate Point
Two points have special meaning on every proportional relationship graph. The origin, (0, 0), shows that when the input is zero, the output is also zero. In the cycling example, 0 hours corresponds to 0 miles traveled. The point (1, r) identifies the unit rate, where r is the constant of proportionality. Since the cyclist travels 12 miles in 1 hour, the unit-rate point is (1, 12), and r = 12. This point answers the question, “How much output occurs for one unit of input?” Other points can be generated by scaling the unit-rate point. Doubling both coordinates of (1, 12) gives (2, 24), while halving both coordinates gives (0.5, 6). These scaled pairs remain on the same proportional line.
Explain Points in Context
A point on a graph should be explained with both quantities and their units. On the cycling graph, the point (2.5, 30) means that after 2.5 hours, the cyclist has traveled 30 miles. Do not describe it only as “2.5 and 30,” because that leaves out the situation. You can also use a point to answer a question. If the cyclist rides for 4 hours, locate x = 4 and move up to the line. The corresponding point is (4, 48), so the cyclist travels 48 miles. To find how long 36 miles takes, begin at y = 36, move across to the line, and then move down to x = 3. Thus, (3, 36) means 36 miles are traveled in 3 hours.
Check for a Proportional Graph
A graph represents a proportional relationship when it is a straight line that passes through the origin. You can also check points by calculating y/x for nonzero x-values. For the cycling points (1, 12), (2, 24), and (3, 36), the ratios are 12/1, 24/2, and 36/3. Each equals 12, so the relationship is proportional. Compare this with a line described by y = 12x + 5. It crosses the y-axis at (0, 5), not at the origin. Although it is straight and increases at a constant rate, it is not proportional because the output is already 5 when the input is zero. Remember both requirements: the graph must be straight, and it must include (0, 0).