
Graphing Quadratic Functions and Interpreting Key Features
Students graph quadratic functions and connect intercepts, vertices, maximum or minimum values, and symmetry to real-world contexts.

Illustrations are auto-generated and may be placeholders. They can be refreshed to match the narration.
Recognizing Quadratic Functions
A quadratic function can be written in standard form as f(x) = ax² + bx + c, where a is not zero. Its graph is a U-shaped curve called a parabola. If a is positive, the parabola opens upward; if a is negative, it opens downward. Quadratics have a constant second difference when their outputs are listed for equally spaced x-values. For example, f(x) = x² - 4 has outputs 5, 0, -3, -4, and -3 for x-values -3, -2, -1, 0, and 1. The first differences change, but the second differences are always 2. The equation y = 3x + 1 is not quadratic because its greatest exponent is 1, while y = -2x² + 5x is quadratic because its greatest exponent is 2.

Identifying the Vertex and Axis of Symmetry
The vertex is the turning point of a parabola. It represents a minimum when the parabola opens upward and a maximum when the parabola opens downward. The vertical line through the vertex is the axis of symmetry, which divides the graph into matching halves. In vertex form, f(x) = a(x - h)² + k, the vertex is (h, k), and the axis of symmetry is x = h. For example, f(x) = 2(x - 3)² - 5 has vertex (3, -5) and axis of symmetry x = 3. Because a = 2 is positive, the graph opens upward, so -5 is the function’s minimum value. Points the same horizontal distance from x = 3 have equal outputs. For instance, f(2) and f(4) both equal -3.

Finding and Interpreting Intercepts
Intercepts show where a graph meets the coordinate axes. An x-intercept occurs where y = 0, so x-intercepts are found by solving f(x) = 0. A y-intercept occurs where x = 0, so it is found by evaluating f(0). Consider f(x) = x² - 5x + 6. To find the x-intercepts, factor the equation: 0 = (x - 2)(x - 3). Therefore, x = 2 or x = 3, giving intercepts (2, 0) and (3, 0). To find the y-intercept, calculate f(0) = 6, giving (0, 6). In a real-world model, x-intercepts may represent times when an object is on the ground or when profit is zero. The y-intercept often represents an initial value, such as starting height or starting cost.

Graphing from Key Features
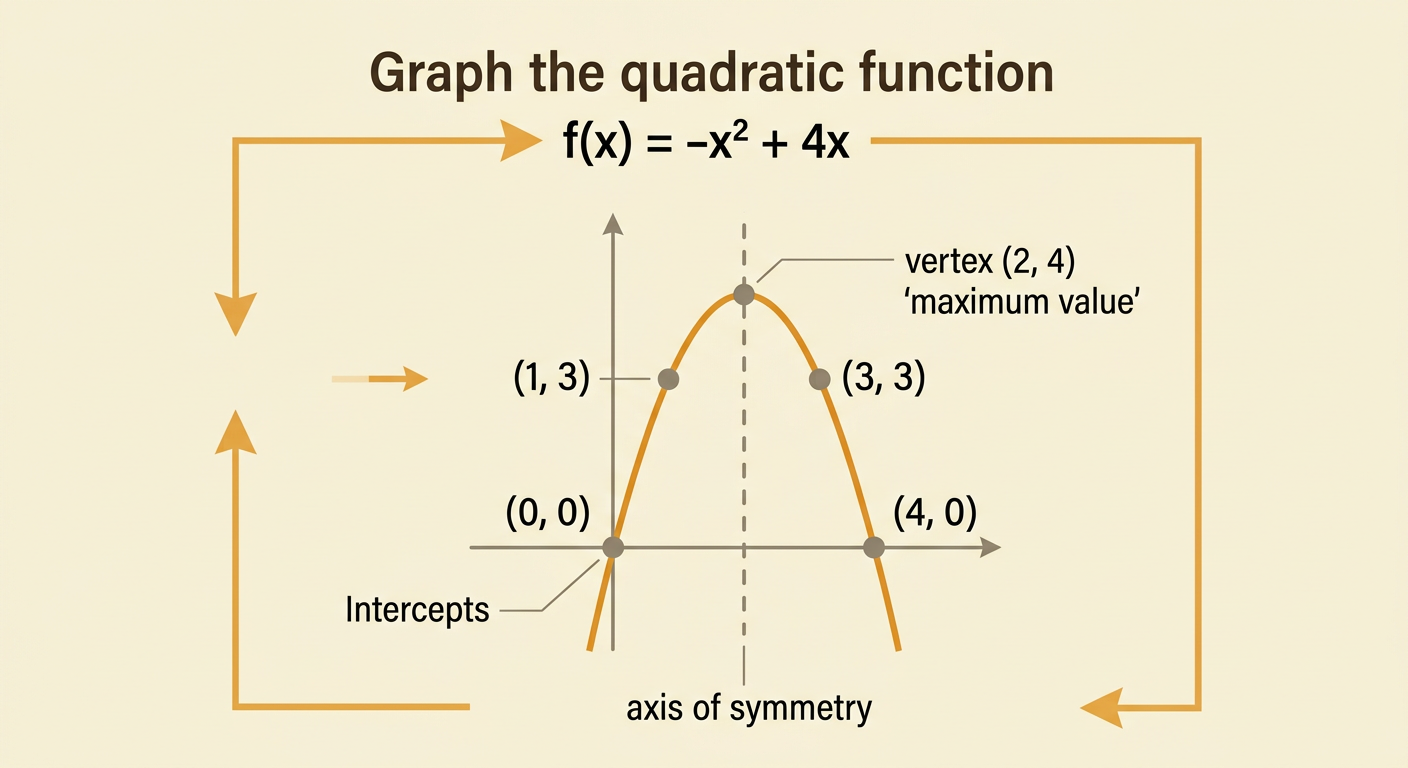
A quadratic graph can be sketched accurately by combining its vertex, axis of symmetry, intercepts, and direction of opening. Consider f(x) = -x² + 4x. Factoring gives f(x) = -x(x - 4), so the x-intercepts are (0, 0) and (4, 0). The axis of symmetry lies halfway between the x-intercepts, at x = 2. Substituting x = 2 gives f(2) = 4, so the vertex is (2, 4). Because the leading coefficient is negative, the parabola opens downward, and 4 is its maximum value. Plot the intercepts and vertex, draw the axis of symmetry, and add matching points such as (1, 3) and (3, 3). Then connect the points with a smooth, symmetrical curve rather than straight segments.
Applying Quadratics to Real-World Models
Quadratic functions can model situations in which a quantity rises and then falls, or falls and then rises. Suppose the height of a launched ball is modeled by h(t) = -16t² + 64t + 5, where t is time in seconds and h is height in feet. The y-intercept h(0) = 5 means the ball starts 5 feet above the ground. The vertex occurs at t = -b divided by 2a, so t = -64 divided by 2(-16) = 2 seconds. Evaluating h(2) gives 69, meaning the ball reaches a maximum height of 69 feet after 2 seconds. The positive solution to h(t) = 0 is about 4.08, so the ball reaches the ground about 4.08 seconds after launch. Only nonnegative time values make sense in this context.
