
Graphing Quadratic Functions in Vertex Form
Students graph quadratic functions written in vertex form and identify how the parameters determine the vertex, axis of symmetry, opening direction, and width of the parabola.

Illustrations are auto-generated and may be placeholders. They can be refreshed to match the narration.
Review the Parent Quadratic Function
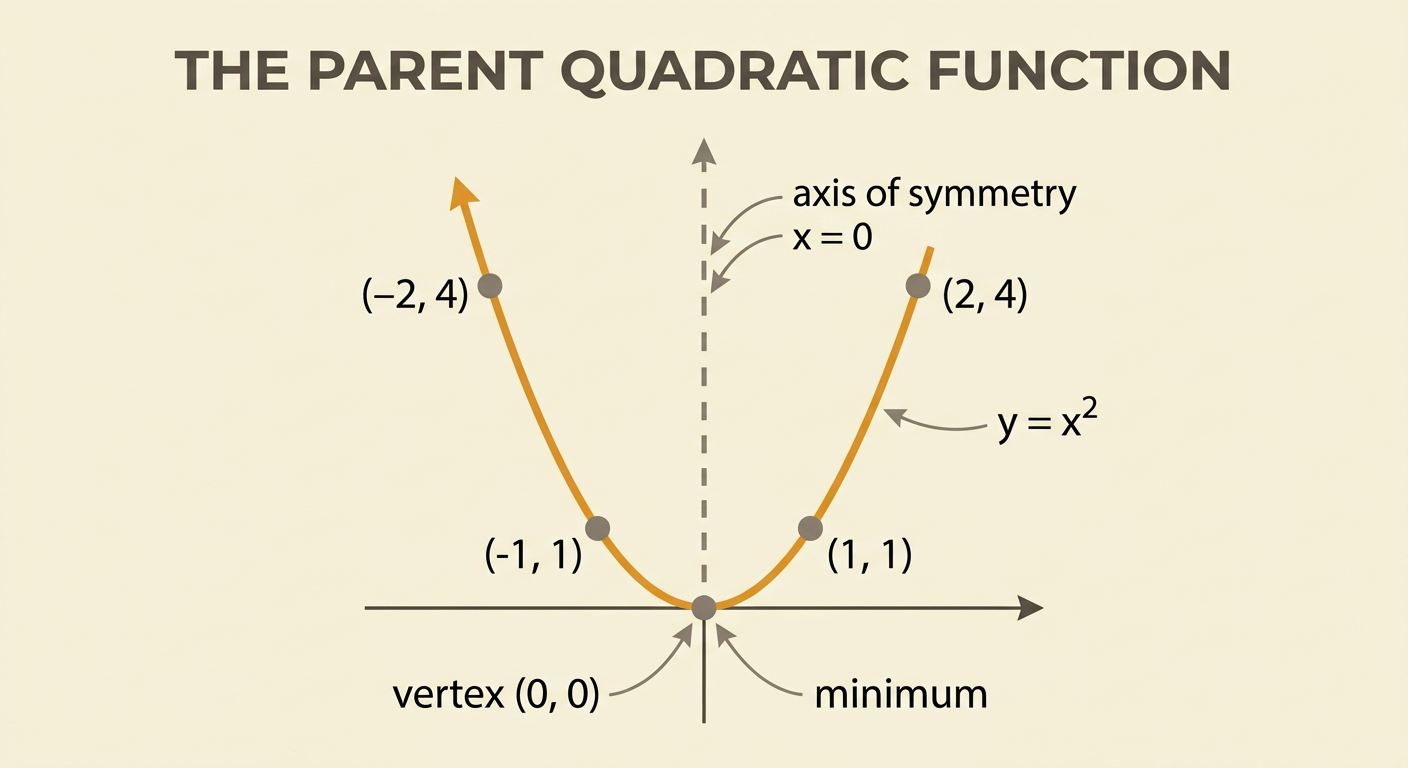
The parent quadratic function is y = x². Its graph is a U-shaped curve called a parabola. The lowest point is the vertex at (0, 0), which is also the minimum. The vertical line x = 0 divides the graph into matching halves, so it is the axis of symmetry. To plot the function, choose x-values and square them. For example, x = 1 and x = −1 both give y = 1, while x = 2 and x = −2 both give y = 4. These paired points show the graph’s symmetry. The parabola opens upward, crosses both axes at (0, 0), has domain all real numbers, and has range y ≥ 0.
Interpret Vertex Form
A quadratic function in vertex form is y = a(x − h)² + k. Each parameter describes part of the graph. The value h gives the horizontal position of the vertex, and k gives its vertical position. Therefore, the vertex is (h, k). Be careful with the sign inside the parentheses: x − 3 gives h = 3, but x + 3 can be written as x − (−3), so h = −3. The value a controls whether the parabola opens upward or downward and how narrow or wide it appears. For example, in y = 2(x − 3)² + 1, the values are a = 2, h = 3, and k = 1, so the vertex is (3, 1).

Identify the Vertex and Axis of Symmetry
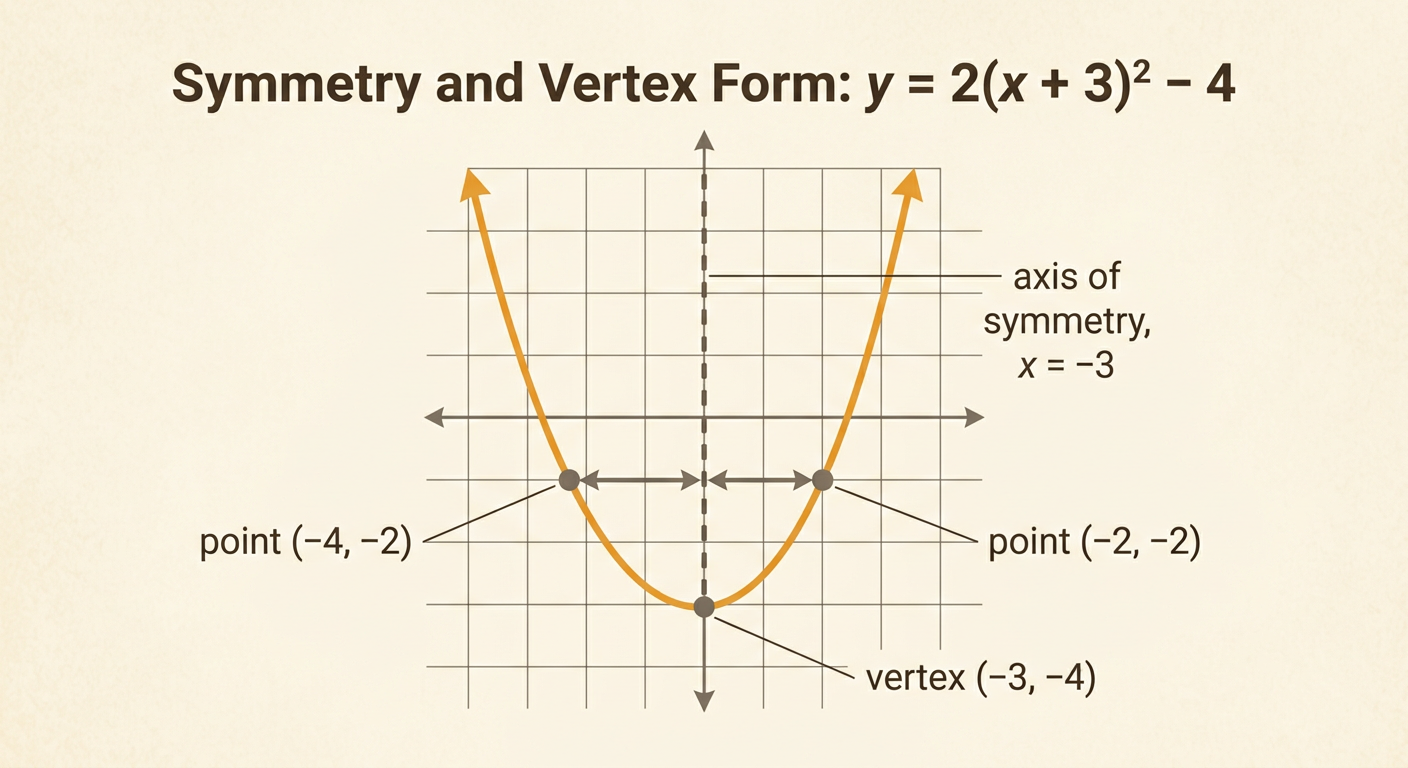
In y = a(x − h)² + k, the vertex is (h, k), and the axis of symmetry is the vertical line x = h. Every point on one side of this line has a matching point the same horizontal distance away on the other side. Consider y = 2(x + 3)² − 4. Rewrite x + 3 as x − (−3), so h = −3 and k = −4. The vertex is (−3, −4), and the axis of symmetry is x = −3. If x = −2, then y = −2. The reflected x-value across the axis is −4, and it also gives y = −2. These symmetric points help you draw an accurate parabola without calculating every possible point.
Analyze Reflections and Vertical Stretching
The coefficient a determines the opening direction and width of a parabola. If a is positive, the parabola opens upward. If a is negative, the graph is reflected across a horizontal line through its vertex and opens downward. The size of |a| controls width. When |a| > 1, the graph is vertically stretched and appears narrower than y = x². When 0 < |a| < 1, it is vertically compressed and appears wider. For example, y = −3x² opens downward and is narrower than y = x² because a = −3. In contrast, y = 0.5x² opens upward and is wider. Changing a does not move the vertex when h and k stay the same.

Graph a Quadratic from Vertex Form
To graph a quadratic from vertex form, first plot the vertex and draw the axis of symmetry. Next, use the value of a to find points on both sides. For y = −0.5(x − 2)² + 3, the vertex is (2, 3), the axis is x = 2, and the negative a-value means the graph opens downward. Move one unit right from the vertex: when x = 3, y = 2.5. Reflect that point to get (1, 2.5). Move two units from the vertex: x = 4 and x = 0 both give y = 1. Plot these symmetric pairs, then draw a smooth downward-opening curve through them. Do not connect the points with straight line segments.

Check Key Features of the Parabola
After graphing, check the vertex, axis of symmetry, opening direction, intercepts, and maximum or minimum. For y = (x + 1)² − 4, the vertex is (−1, −4), the axis is x = −1, and the positive a-value means the graph opens upward. Therefore, the vertex is a minimum. To find the y-intercept, substitute x = 0 and get y = −3, so the point is (0, −3). To find the x-intercepts, set y = 0: (x + 1)² = 4. This gives x + 1 = 2 or x + 1 = −2, so x = 1 or x = −3. The intercepts (1, 0) and (−3, 0) are equally distant from the axis, confirming the graph’s symmetry.
