Habitat Detectives: Comparing Living Things
Students observe photographs of two habitats, record and graph the plants and animals they find, and compare the habitats' biodiversity.

Illustrations are auto-generated and may be placeholders. They can be refreshed to match the narration.
What Is a Habitat?
A habitat is the place where a living thing gets what it needs to survive. A habitat provides food, water, shelter, air, and space. Habitats can be large, like a forest, or small, like the space under a log. Different plants and animals have features and behaviors that help them live in particular habitats. For example, a frog can find water, insects, and hiding places near a pond. A rabbit can find grass and shelter in a meadow. Sunlight, soil, rocks, and water are nonliving parts of habitats, but they affect which living things can survive there. Habitat detectives look closely at these parts and at the plants and animals that share each place.

Observe Two Habitats
Scientists begin by observing carefully. Study one photograph of a meadow and one photograph of a pond. Scan each photograph from left to right and then from top to bottom so you do not miss small living things. Look for plants, birds, insects, and other animals. In the meadow photograph, you might observe grass, daisies, clover, milkweed, a robin, a sparrow, a butterfly, a bee, a grasshopper, and a rabbit. In the pond photograph, you might find cattails, water lilies, a duck, a heron, a dragonfly, a frog, a turtle, and a fish. Record only what you can see. A photograph shows one place at one moment, so an animal that is not pictured may still live in that habitat.

Sort and Count Living Things
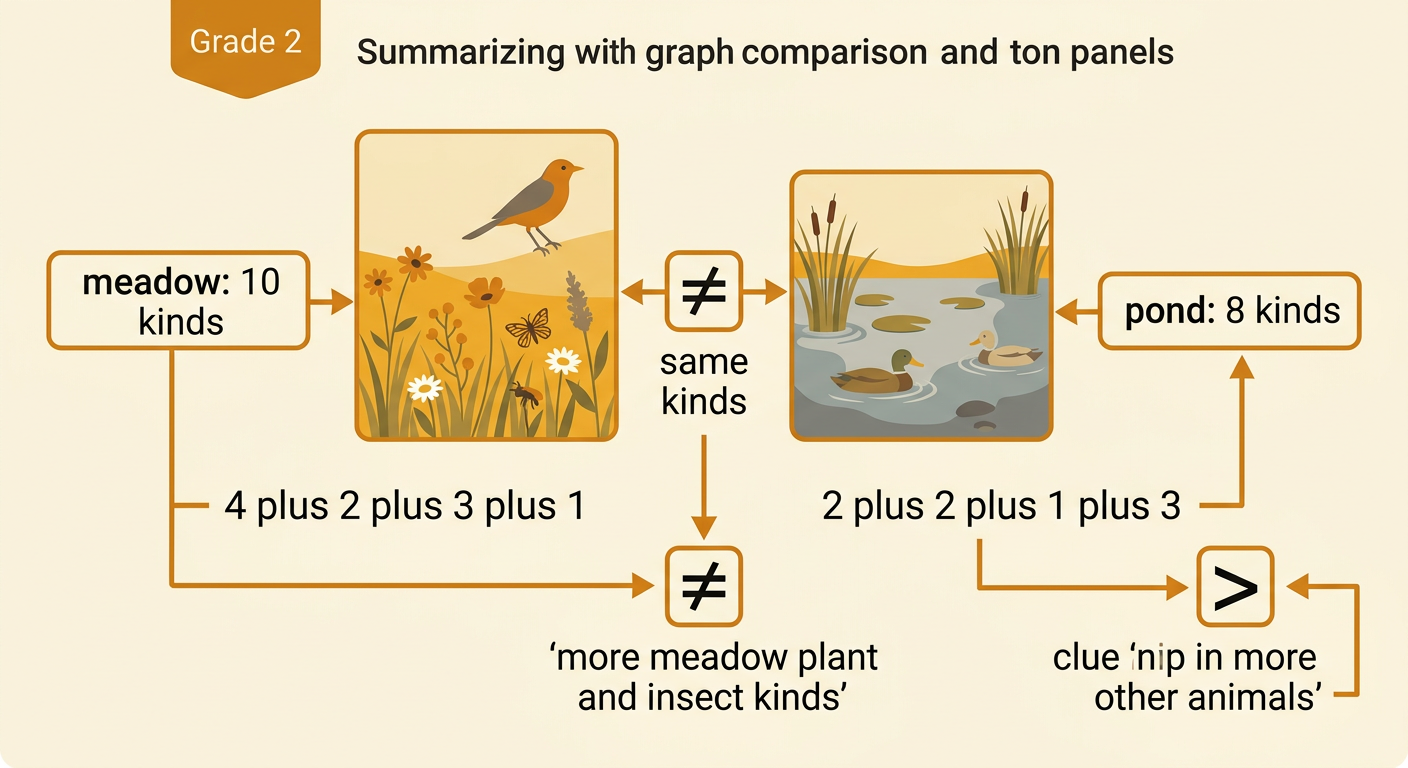
After observing, sort the living things into categories. Use four categories: plants, birds, insects, and other animals. Count the number of different kinds in each category, not the number of individual organisms. For example, three daisies are still one kind of plant. In the sample meadow, there are four plant kinds, two bird kinds, three insect kinds, and one other animal kind. In the sample pond, there are two plant kinds, two bird kinds, one insect kind, and three other animal kinds. Work with classmates to check names and counts. Create a shared data table, and place a tally mark beside each different kind. If you are unsure about an organism, mark it with a question mark and investigate it together.

Create a Habitat Graph
Turn the class data table into a bar graph. Write the four categories along the bottom: plants, birds, insects, and other animals. Write “Number of different kinds” along the side. Make two bars for each category, one for the meadow and one for the pond. Let each square represent one kind. For plants, the meadow bar reaches 4 and the pond bar reaches 2. For birds, both bars reach 2. For insects, the meadow bar reaches 3 and the pond bar reaches 1. For other animals, the meadow bar reaches 1 and the pond bar reaches 3. Add a key so readers can identify the habitats. Check that each bar matches the data before using the graph to answer questions.

Compare Biodiversity
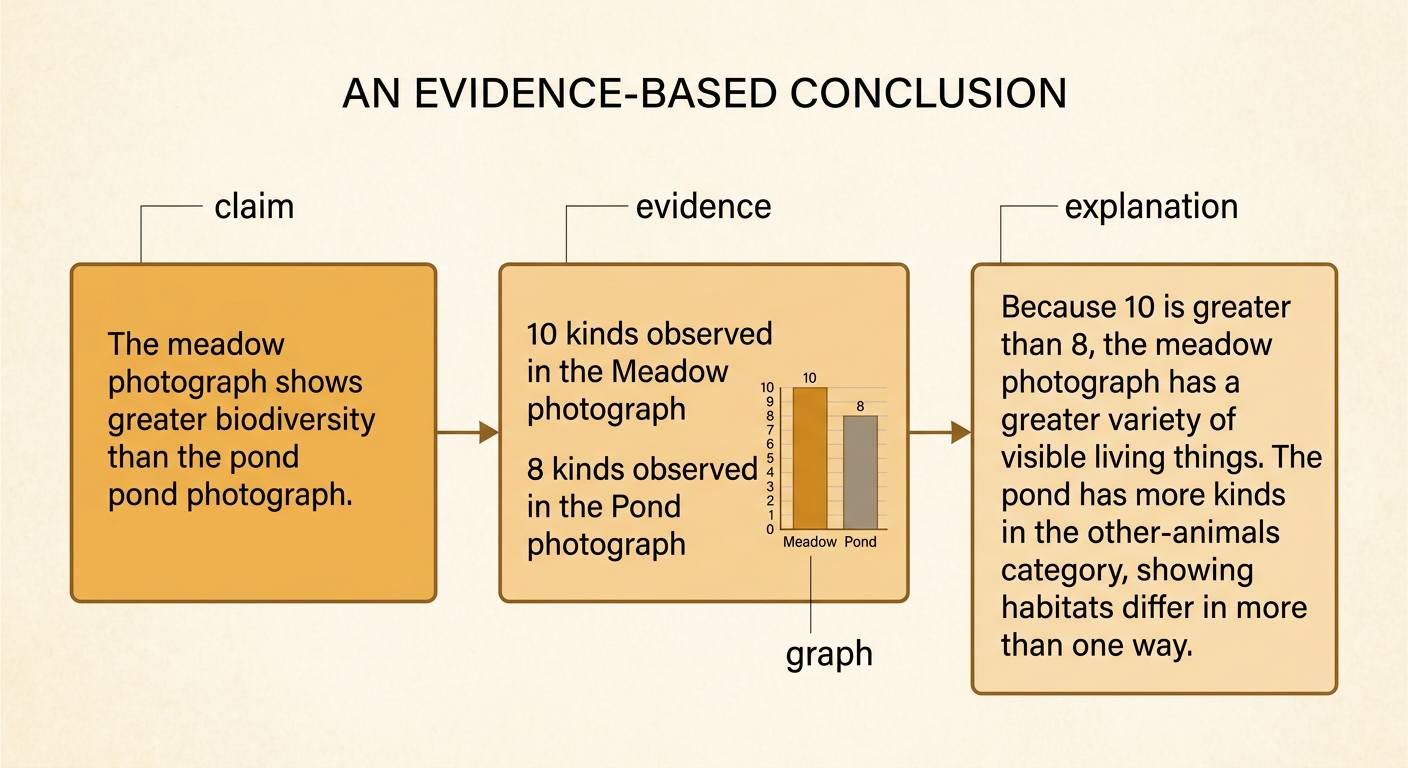
Biodiversity means the variety of living things in a place. Use the graph to compare the number of different kinds, not just the total number of individual organisms. Add the four meadow bars: 4 + 2 + 3 + 1 = 10 kinds. Add the pond bars: 2 + 2 + 1 + 3 = 8 kinds. In these photographs, the meadow has more observed kinds overall. The graph also shows important category differences. Both habitats have two bird kinds, but the meadow has more plant and insect kinds. The pond has more kinds in the other-animals category. This does not mean one habitat is better. It means the habitats support different collections of life. Remember that the comparison describes only the organisms visible in the photographs.
Share an Evidence-Based Conclusion
An evidence-based conclusion includes a claim, evidence, and an explanation. The claim answers the investigation question. The evidence gives exact observations or graph values. The explanation tells how the evidence supports the claim. For example: “The meadow photograph shows greater biodiversity than the pond photograph. We observed 10 different kinds in the meadow and 8 in the pond. Because 10 is greater than 8, the meadow photograph contains a greater variety of visible living things.” Add that the pond had more kinds in the other-animals category, showing that the habitats differ in more than one way. Work with classmates to write, revise, and share a class conclusion. Point to the graph while presenting so listeners can connect each statement to the recorded evidence.