Habitat Fragmentation and Biodiversity: Designing Wildlife Corridors
Students analyze evidence about how habitat fragmentation affects biodiversity and design a wildlife corridor to reduce its ecological impact.

Illustrations are auto-generated and may be placeholders. They can be refreshed to match the narration.
What Is Habitat Fragmentation?
Habitat fragmentation occurs when one large, connected habitat is divided into smaller, isolated patches. Roads, farms, neighborhoods, dams, and logging areas can create these divisions. Fragmentation reduces the total amount of habitat and increases edge habitat, where conditions differ from the interior. Edges may have more light, wind, invasive species, predators, and human disturbance. Small populations in isolated patches may have difficulty finding food, mates, or seasonal habitat. They may also lose genetic diversity over time. For example, a highway built through a forest can separate a deer population and prevent salamanders from safely reaching breeding ponds. Fragmentation does not affect every species equally. Generalist species may tolerate disturbed areas, while species requiring large territories or deep forest conditions are often more vulnerable.

Reading a Fragmentation Map
A fragmentation map helps scientists identify habitat patches, barriers, and possible routes between resources. Begin by reading the title, legend, scale, and direction marker. Then locate suitable habitat and barriers such as roads, fences, rivers, or developed land. Patch size and distance between patches matter because many animals cannot safely cross wide open areas. The map scale converts map distance into actual distance. For example, if 1 centimeter represents 500 meters, two forest patches 3 centimeters apart are 1.5 kilometers apart. Land cover also affects movement: a bobcat may cross shrubs more readily than a parking lot. Maps can reveal pinch points, where movement is forced through a narrow space. However, a map alone cannot prove that animals use a route; field observations, tracks, cameras, or GPS data are also needed.

Analyzing Biodiversity Data
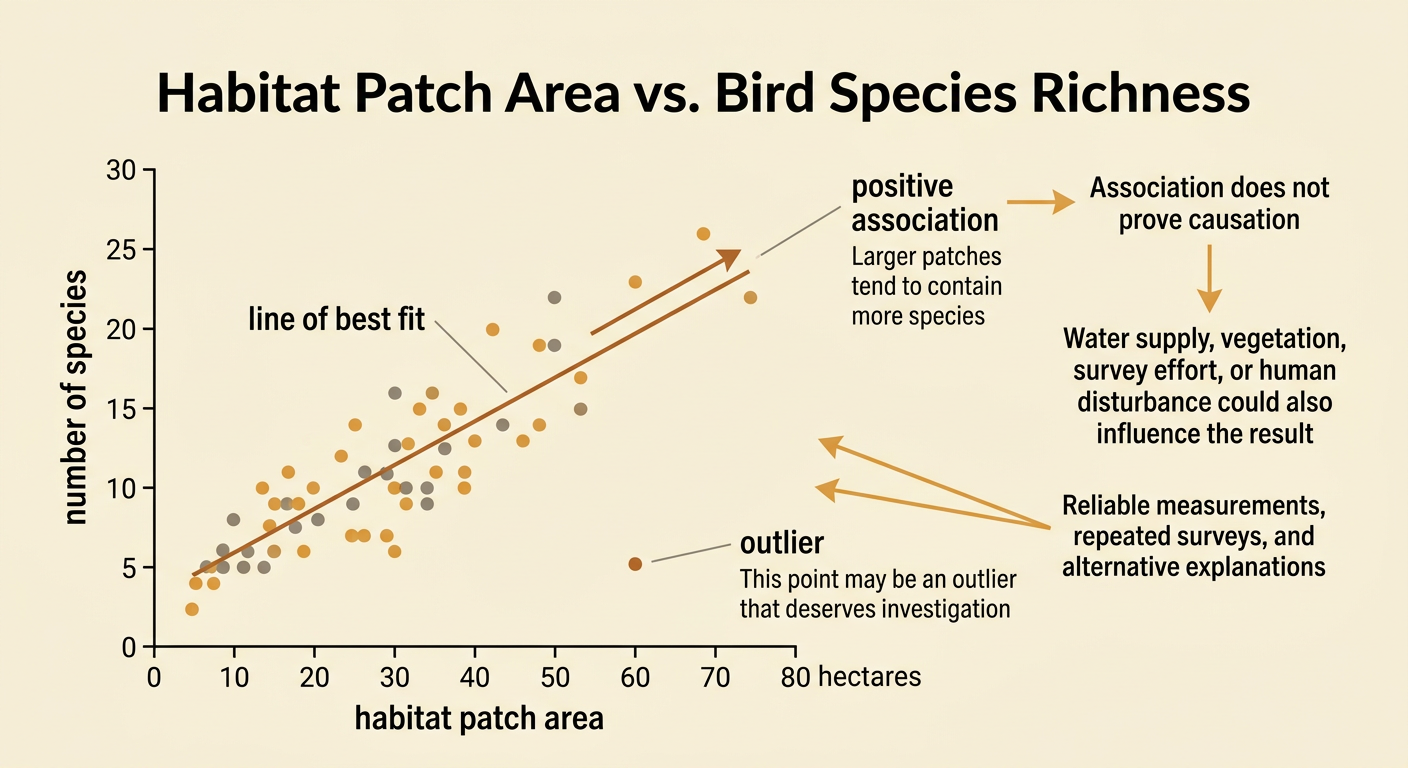
Scientists can test claims about fragmentation by comparing two quantitative variables. One useful graph places habitat patch area on the horizontal axis and the number of species on the vertical axis. Each point represents one surveyed patch. If the points generally rise from left to right, the variables have a positive association: larger patches tend to contain more species. For example, surveys might find 8 bird species in a 5-hectare patch, 14 in a 20-hectare patch, and 25 in a 60-hectare patch. A line of best fit summarizes the overall pattern, while points far from the line are possible outliers. Association supports a claim but does not prove causation. Differences in water, vegetation, survey effort, or human disturbance may also influence species richness. Strong conclusions require reliable measurements, repeated surveys, and consideration of alternative explanations.
How Wildlife Corridors Help
A wildlife corridor is a strip or series of habitat areas that connects otherwise separated patches. Corridors can allow organisms to reach food, water, mates, breeding sites, and seasonal ranges. Movement between populations can also increase gene flow, which helps maintain genetic diversity. A corridor may be a forested strip, a hedgerow, a restored stream bank, a road underpass, or a bridge covered with native vegetation. For example, a vegetated overpass can help elk cross a highway without entering traffic, reducing both animal deaths and vehicle collisions. Corridor design must match the target species. A frog may need cool, moist ground and small tunnels, while a cougar needs a much wider route with little human activity. Corridors are not complete solutions: poor placement can expose animals to predators, invasive species, disease, or additional human disturbance.

Designing an Evidence-Based Corridor
An evidence-based corridor design begins with a clearly defined problem and measurable criteria. Identify the target species, its habitat needs, movement distance, and major causes of death. Use maps and data to compare possible routes. A strong design connects high-quality habitat, avoids steep or heavily developed land, crosses as few roads as possible, and is wide enough for the species. For example, students designing a corridor for black bears might choose a wooded route between two mountain forests and add an underpass where the route meets a highway. They could evaluate routes by assigning scores for habitat quality, length, road crossings, cost, and nearby human activity. Camera traps and track surveys could measure corridor use after construction. If bears avoid the route, students could refine the solution by adding cover, improving fencing, reducing nighttime disturbance, or relocating an entrance.

Evaluating Benefits and Trade-Offs
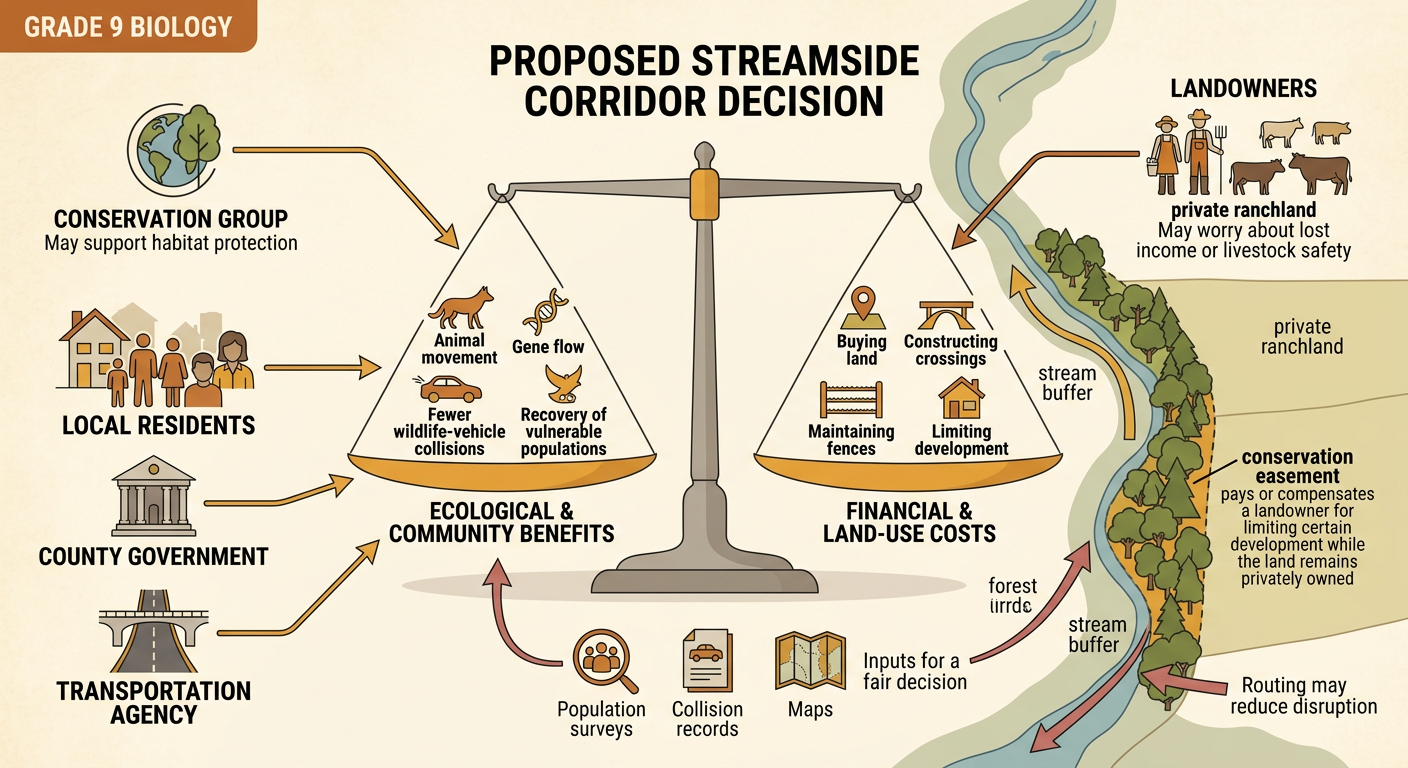
Corridor proposals should be evaluated for ecological benefits, economic costs, and effects on communities. Benefits may include greater animal movement, increased gene flow, fewer wildlife-vehicle collisions, and recovery of vulnerable populations. Costs may include purchasing land, building crossings, maintaining fences, or limiting development. Political decisions determine zoning, transportation funding, and which groups participate in planning. For example, a county might consider a forest corridor across private ranchland. Conservation groups may support habitat protection, while landowners may worry about lost income or livestock safety. A compromise could use conservation easements, payments to landowners, and a route along an existing stream buffer. Students should compare evidence from population surveys, collision records, maps, budgets, and stakeholder statements. A fair evaluation explains who receives benefits, who bears costs, what uncertainties remain, and how monitoring could guide future changes.