Habitat Fragmentation: Designing for Biodiversity
Students analyze habitat and species data to explain how fragmentation affects biodiversity and evaluate a wildlife corridor as a solution.
Illustrations are auto-generated and may be placeholders. They can be refreshed to match the narration.
Connected Habitats and Fragmented Habitats
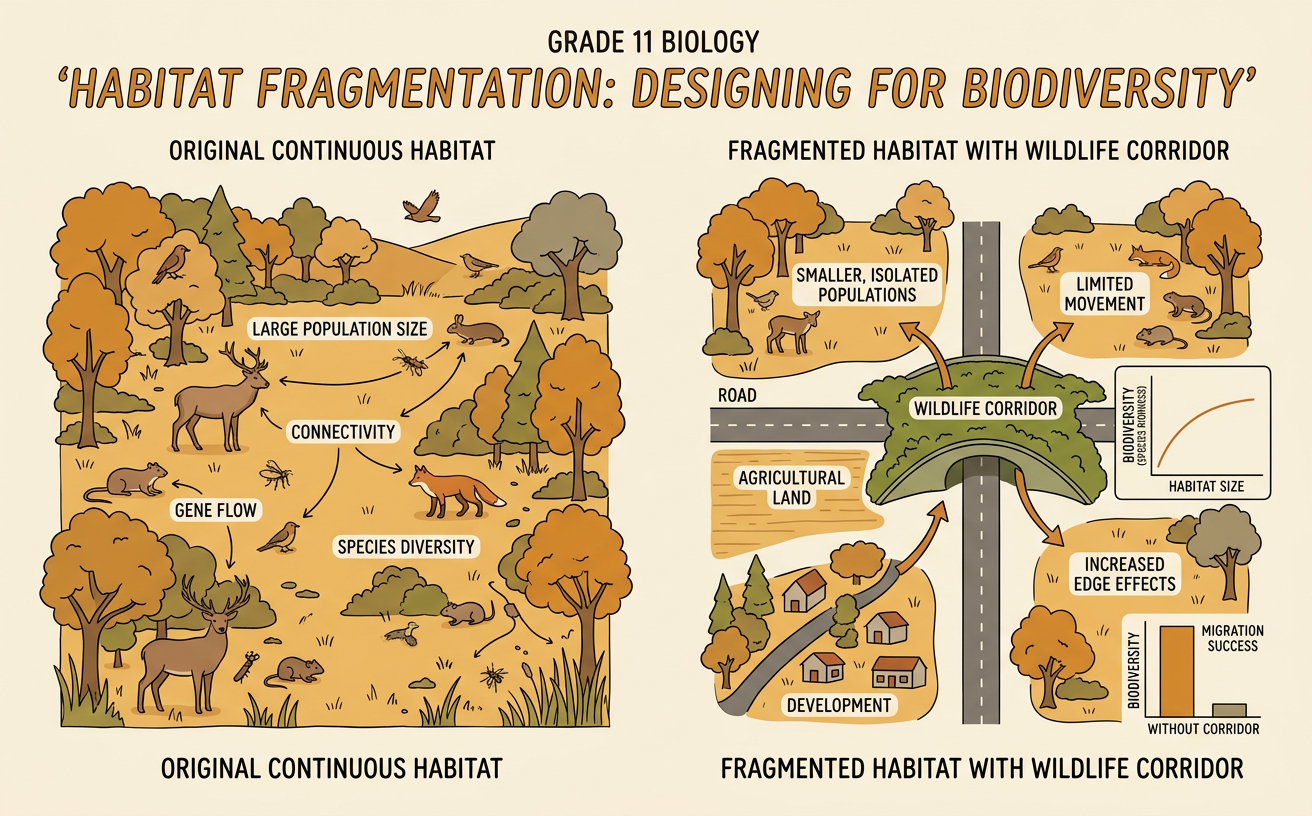
A connected habitat is a large, continuous area where organisms can find food, shelter, mates, and breeding sites without crossing major barriers. Fragmentation occurs when roads, farms, neighborhoods, dams, or other developments divide that habitat into smaller, isolated patches. Fragmentation reduces total habitat area and increases edge habitat, where conditions such as light, temperature, wind, and predator activity differ from the interior. For example, a highway built through a continuous forest may create two smaller forest patches. Birds that prefer shaded forest interiors lose suitable nesting space, while deer and other mobile animals face the danger of vehicle collisions when moving between patches. The severity of fragmentation depends on patch size, distance between patches, and the ability of each species to cross the surrounding landscape.

Measuring Biodiversity
Biodiversity includes variation among genes, species, and ecosystems, but field studies often measure species richness and evenness. Species richness is the number of species present. Evenness describes how equally individuals are distributed among those species. Consider two woodland patches that each contain 100 birds from five species. In Patch A, each species has about 20 individuals. In Patch B, one species has 80 individuals and the other four species have only five each. Both patches have the same richness, but Patch A has greater evenness and therefore greater species diversity. Scientists collect these data with standardized methods such as fixed-area plots, camera traps, point counts, or repeated surveys. Using the same sampling effort in every patch makes comparisons more reliable and reduces the chance that observed differences result from unequal data collection.

Analyzing Fragmentation Data
Scientists can use a scatter plot to examine the relationship between habitat patch size and species richness. Place patch area on the horizontal axis and the number of species on the vertical axis. Suppose surveys produce these pairs: 5 hectares and 8 species, 10 hectares and 11 species, 20 hectares and 16 species, 40 hectares and 23 species, and 80 hectares and 31 species. The upward pattern indicates a positive association: larger patches tend to support more species. A line of best fit can summarize the trend, while points far from the line may identify patches affected by other variables, such as pollution or unusually good habitat quality. This evidence supports a relationship, but it does not prove that patch size alone caused the differences. Sampling effort, habitat type, connectivity, and survey season must also be evaluated before drawing a strong conclusion.

Effects on Species Populations
Fragmentation can reduce population size and separate one population into small groups. Isolated groups may have fewer mating opportunities, lower genetic diversity, and a greater risk of local extinction after disease, wildfire, or extreme weather. Small patches may also lack enough food or nesting sites for species that require large territories. For example, imagine 60 salamanders living around connected forest wetlands. A new road blocks movement between breeding ponds, leaving three groups of 20. If one pond dries during a drought, salamanders from the other groups may be unable to recolonize it. Roads can also cause direct mortality during seasonal migration. Species respond differently, however. A wide-ranging mammal may cross open land, while a moisture-dependent salamander may avoid a dry, exposed gap. Therefore, population effects must be evaluated using species-specific movement and habitat data.

Evaluating a Wildlife Corridor
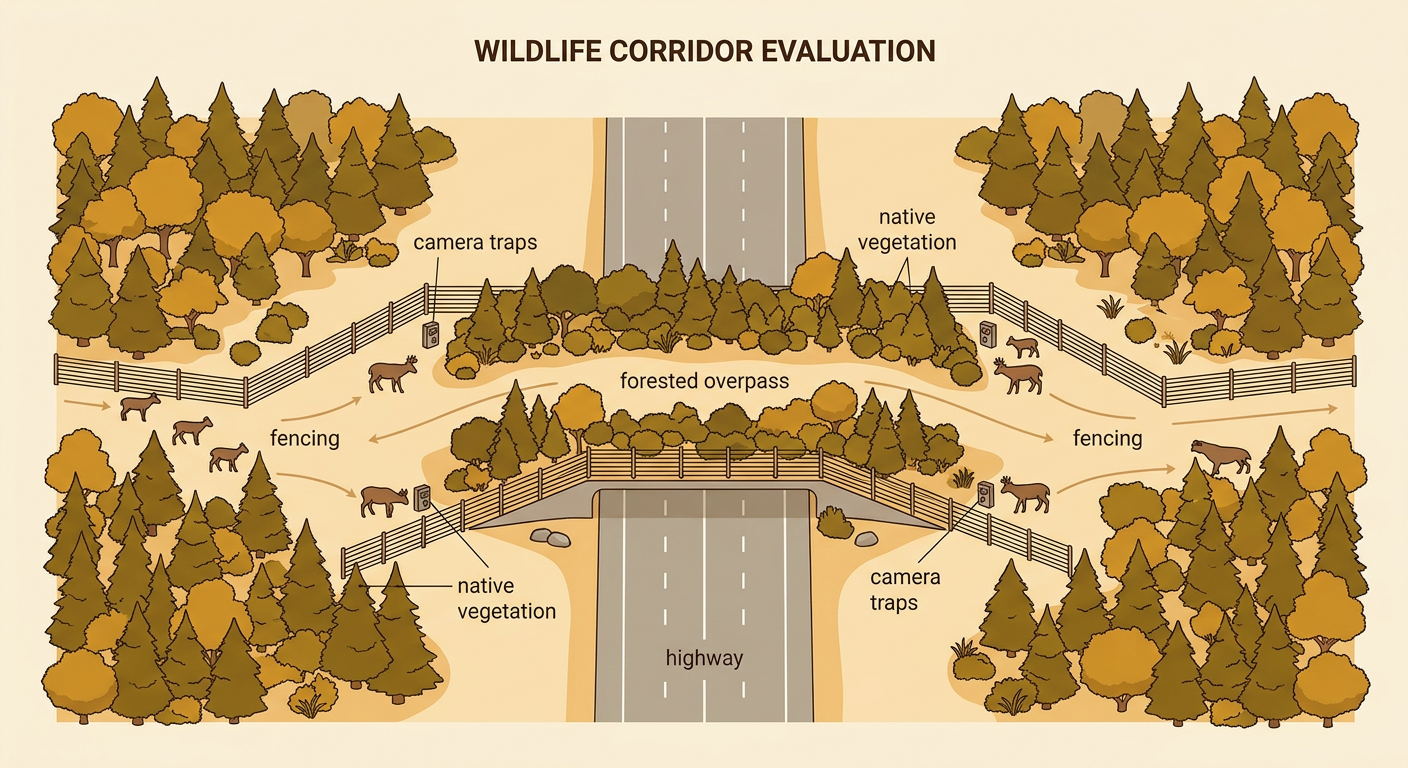
A wildlife corridor is a strip of suitable habitat that connects otherwise separated patches. Corridors can support movement, migration, mating, and recolonization, but their design must match the target species. Suppose planners propose a 50-meter-wide forested overpass connecting two woodland patches across a highway. Camera data showing animals approaching both sides provide evidence that the location may be useful. Native vegetation, fencing that guides animals, noise reduction, and long-term maintenance could improve effectiveness. Evaluation should also consider disadvantages: construction cost, land acquisition, invasive species movement, disease spread, and possible conflicts with nearby farms or neighborhoods. Political decisions determine zoning and funding, while economic decisions affect where roads and development occur. A strong evaluation compares corridor use, roadkill rates, gene flow, and population trends before and after construction rather than assuming that any connection will work.
Evidence-Based Recommendation
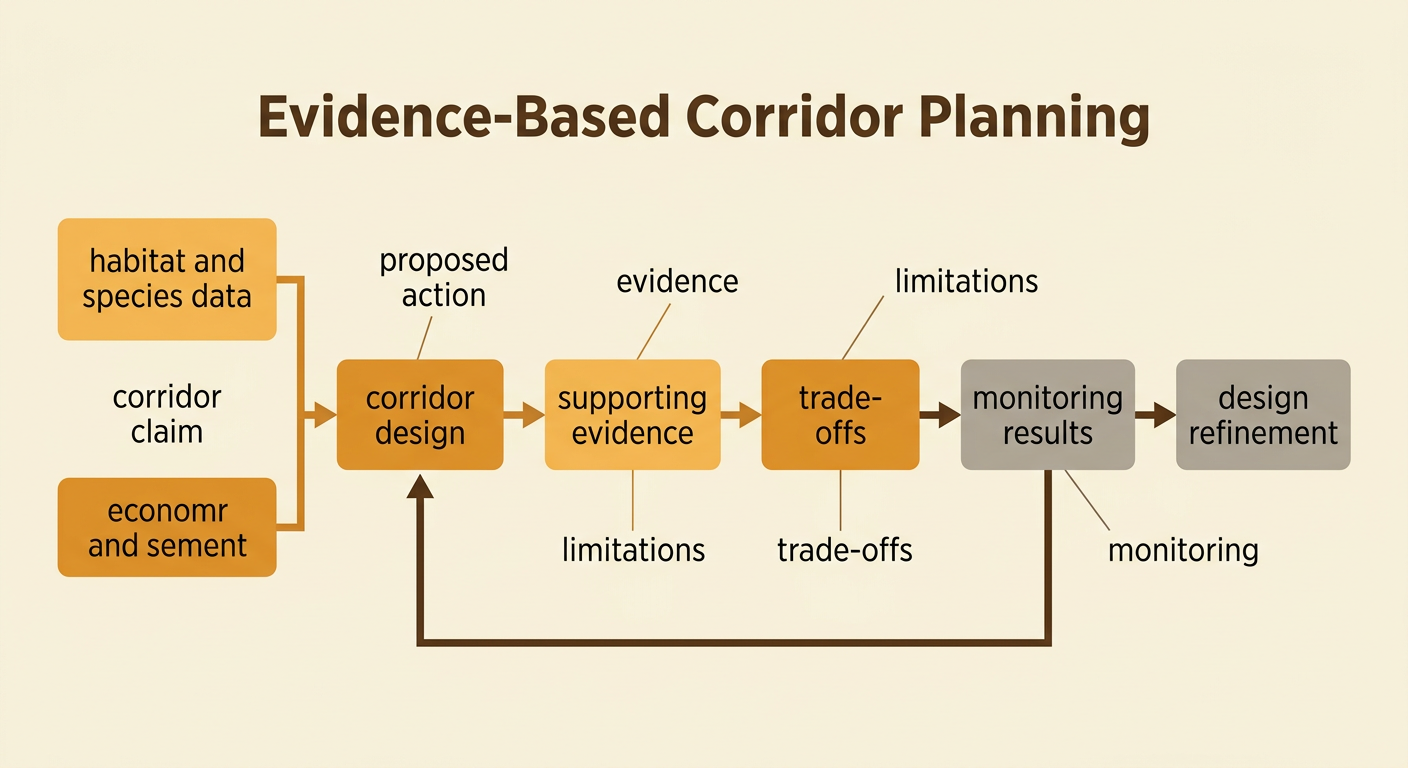
An evidence-based recommendation states a proposed action, supports it with relevant data, addresses limitations, and explains trade-offs. For example: Build the proposed forested overpass because larger, connected patches contain more species, camera surveys show target animals near both entrances, and roadkill records identify the highway as a major barrier. This reasoning connects the solution directly to the evidence. The recommendation should also acknowledge uncertainty. A positive relationship between patch size and richness does not prove that a corridor will increase every population, and short surveys may miss seasonal movement. Decision-makers should compare construction costs with benefits such as reduced vehicle collisions and protected ecosystem services. The plan can be refined by monitoring corridor use, roadkill, species richness, and genetic diversity for several years. If target species rarely use the crossing, managers could add vegetation, adjust fencing, reduce disturbance, or reconsider its location.