
Habitat Life Count
Students observe two habitats, identify the plants and animals found in each, and create a picture graph to compare biodiversity.
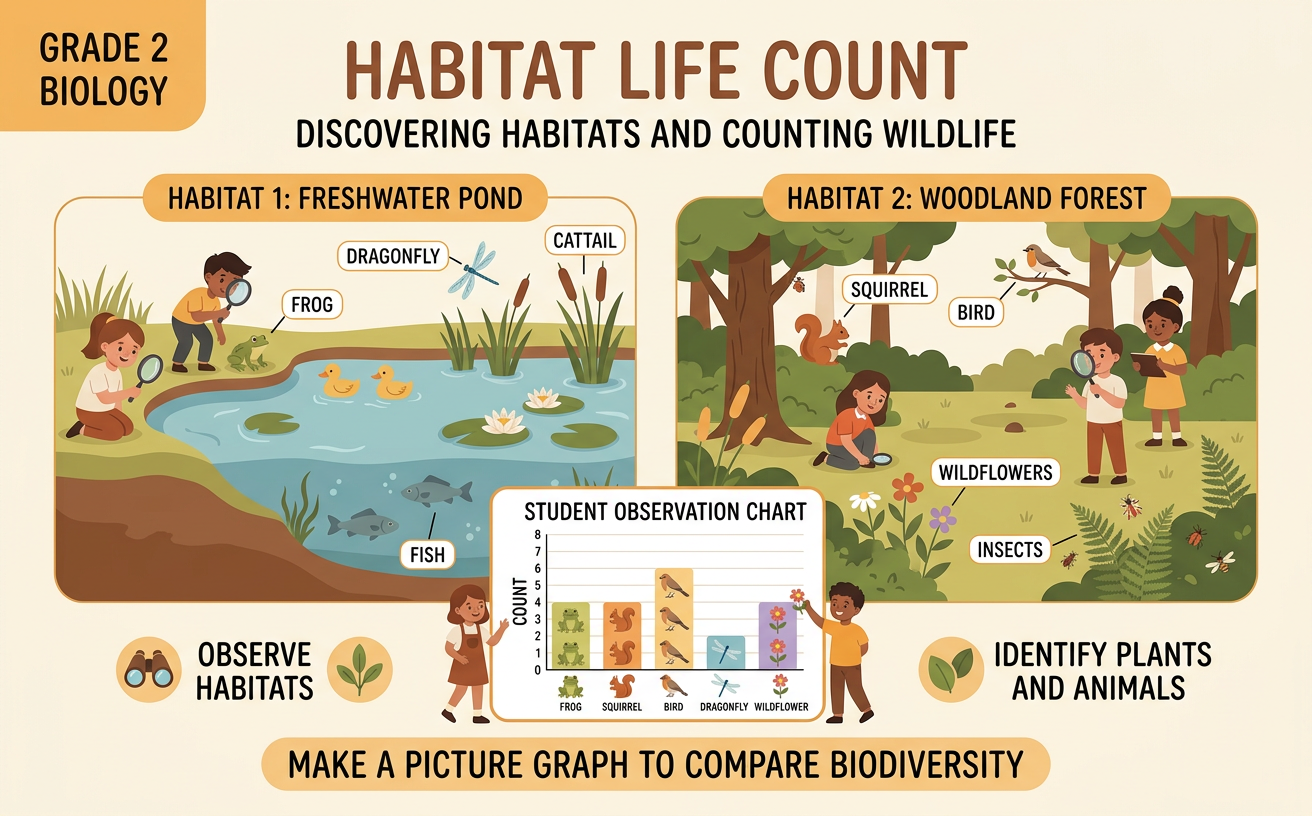
Illustrations are auto-generated and may be placeholders. They can be refreshed to match the narration.
What Is a Habitat?
A habitat is a place where living things get what they need to survive. A habitat provides food, water, shelter, air, and space. Different habitats have different amounts of sunlight, water, soil, and plants. These conditions help determine which plants and animals can live there. For example, a pond is a watery habitat. Water lilies grow in the water, frogs rest near the shore, and fish swim below the surface. A meadow is a sunny, grassy habitat. Clover and tall grasses grow there, while butterflies, rabbits, and birds find food and shelter. Some living things can use more than one habitat. As you study a habitat, look carefully for plants, animals, and signs of life, such as nests, tracks, or chewed leaves.

Observe Two Habitats
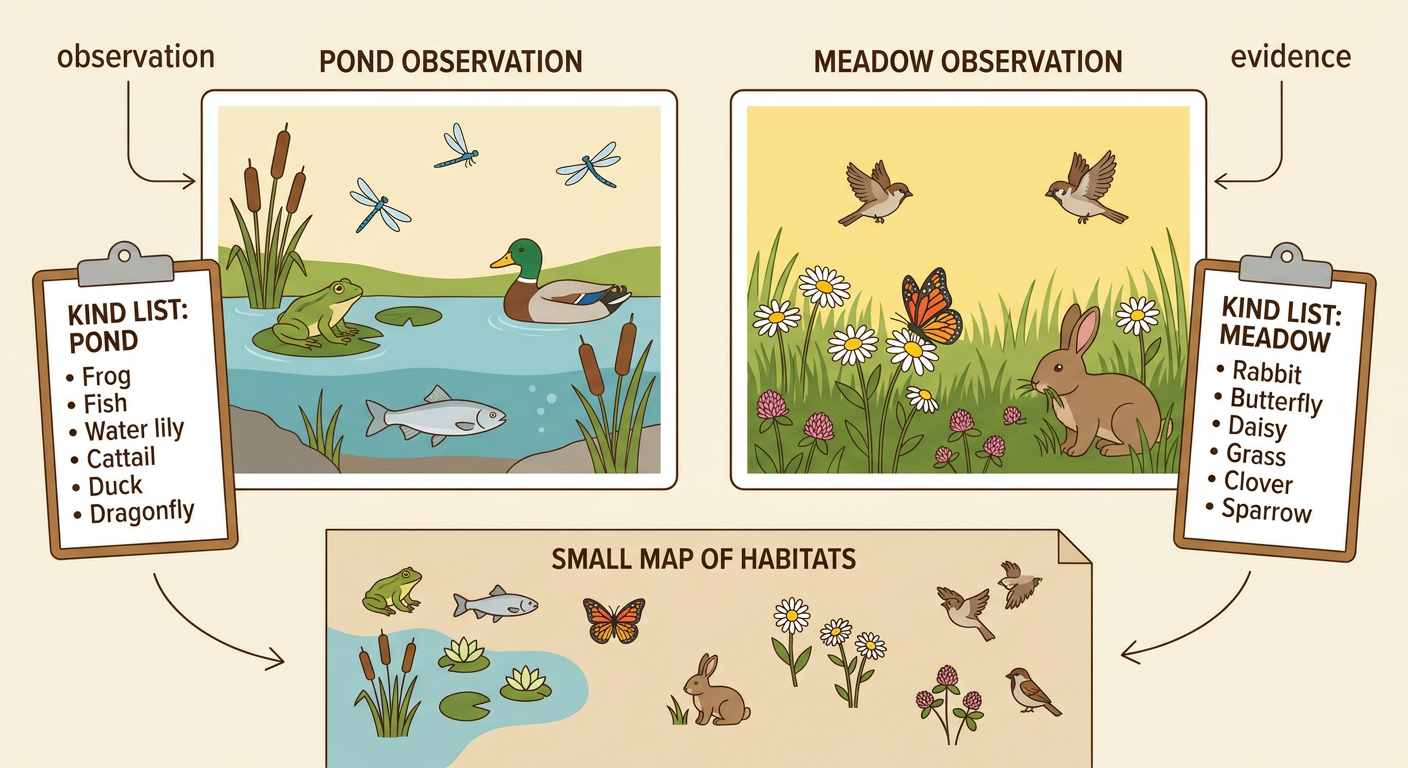
Scientists observe by looking and listening carefully. Study photographs, videos, or real outdoor areas without disturbing the living things. For each habitat, record every different kind of plant and animal you notice. Count a kind only once, even if you see several of them. For example, if you see five frogs at a pond, write frog one time on your list of kinds. At a pond, you might observe water lilies, cattails, dragonflies, ducks, frogs, and fish. In a meadow, you might observe grasses, clover, daisies, bees, butterflies, rabbits, and sparrows. Use a simple map or sketch to show where each living thing was found. Observations are evidence. Record only what you can see, hear, or identify from a reliable source.
Sort Plants and Animals
After observing, sort each living thing into a group. Plants usually stay rooted in one place and make their own food using sunlight. Animals must eat plants or other animals for energy. You can sort the animals into smaller groups to organize the data. Use four categories: plants, insects, birds, and other animals. For example, cattails and water lilies belong in plants. Dragonflies and beetles belong in insects. Ducks and sparrows belong in birds. Frogs, fish, and rabbits belong in other animals. Place each kind under only one heading. Then count the different kinds in each category. If your pond list has cattails, lilies, a dragonfly, a beetle, a duck, a frog, and two kinds of fish, the category counts are two plants, two insects, one bird, and three other animals.

Build a Biodiversity Graph
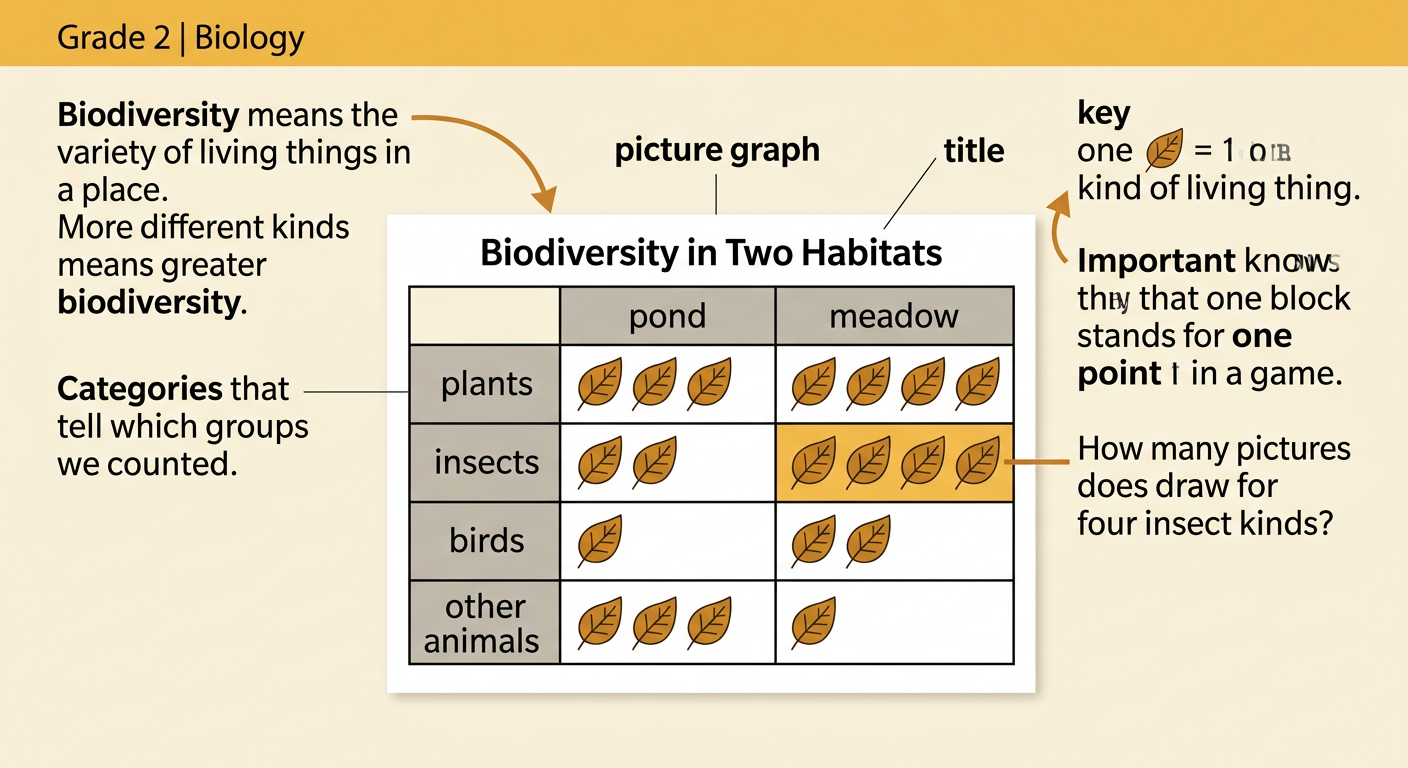
Biodiversity means the variety of living things in a place. A habitat with more different kinds has greater biodiversity. Use your sorted counts to make a picture graph. Give the graph a title and label the four categories. Make a key that says one leaf picture equals one kind of living thing. Suppose the pond has 3 plant kinds, 2 insect kinds, 1 bird kind, and 3 other animal kinds. The meadow has 4 plant kinds, 4 insect kinds, 2 bird kinds, and 1 other animal kind. Draw the correct number of pictures for each habitat and category. Keep the pictures the same size and line them up. Then add each habitat’s counts. The pond has 9 kinds in all, while the meadow has 11 kinds in all.
Compare and Explain
Use the graph to compare the two habitats and answer questions with evidence. First, look for categories with more, fewer, or equal numbers of kinds. In the example, the meadow has more plant, insect, and bird kinds than the pond. The pond has more kinds of other animals. Next, compare the totals. The meadow has 11 kinds, and the pond has 9 kinds, so the meadow has 2 more kinds in this observation. You can write, “The meadow showed greater biodiversity because we recorded 11 kinds of living things there, compared with 9 kinds at the pond.” Explain that the result describes this observation, not every pond or meadow. Weather, season, habitat size, and the time spent observing can affect what is found. A strong explanation names the habitats, compares the data, and uses numbers as evidence.
