
Habitat Match: Where Can an Organism Survive?
Students examine habitat images and data to explain why different organisms survive better in environments that meet their needs.

Illustrations are auto-generated and may be placeholders. They can be refreshed to match the narration.
What Makes a Habitat?
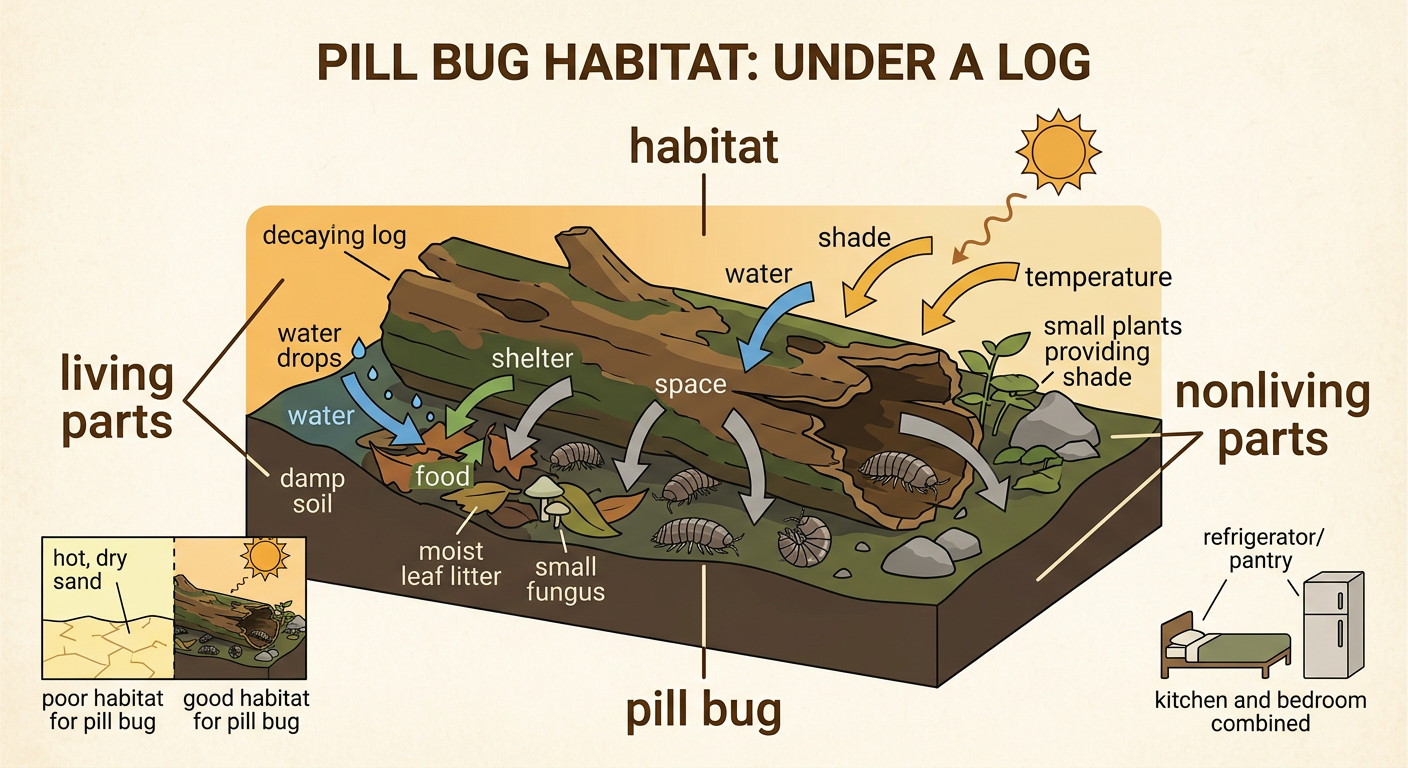
A habitat is the place where an organism gets what it needs to survive. These needs include food, water, air, shelter, space, and suitable temperatures. Habitats can be large, like a desert, or small, like the damp area under a log. Different organisms have different needs. For example, a pill bug can survive well under a moist, shaded log because it needs a damp environment and can eat decaying plant material. It would survive less well on hot, dry sand because its body could lose too much water. When deciding whether a habitat is a good match, look at both living parts, such as plants and prey, and nonliving parts, such as sunlight, soil, water, and temperature.
Observe Two Environments
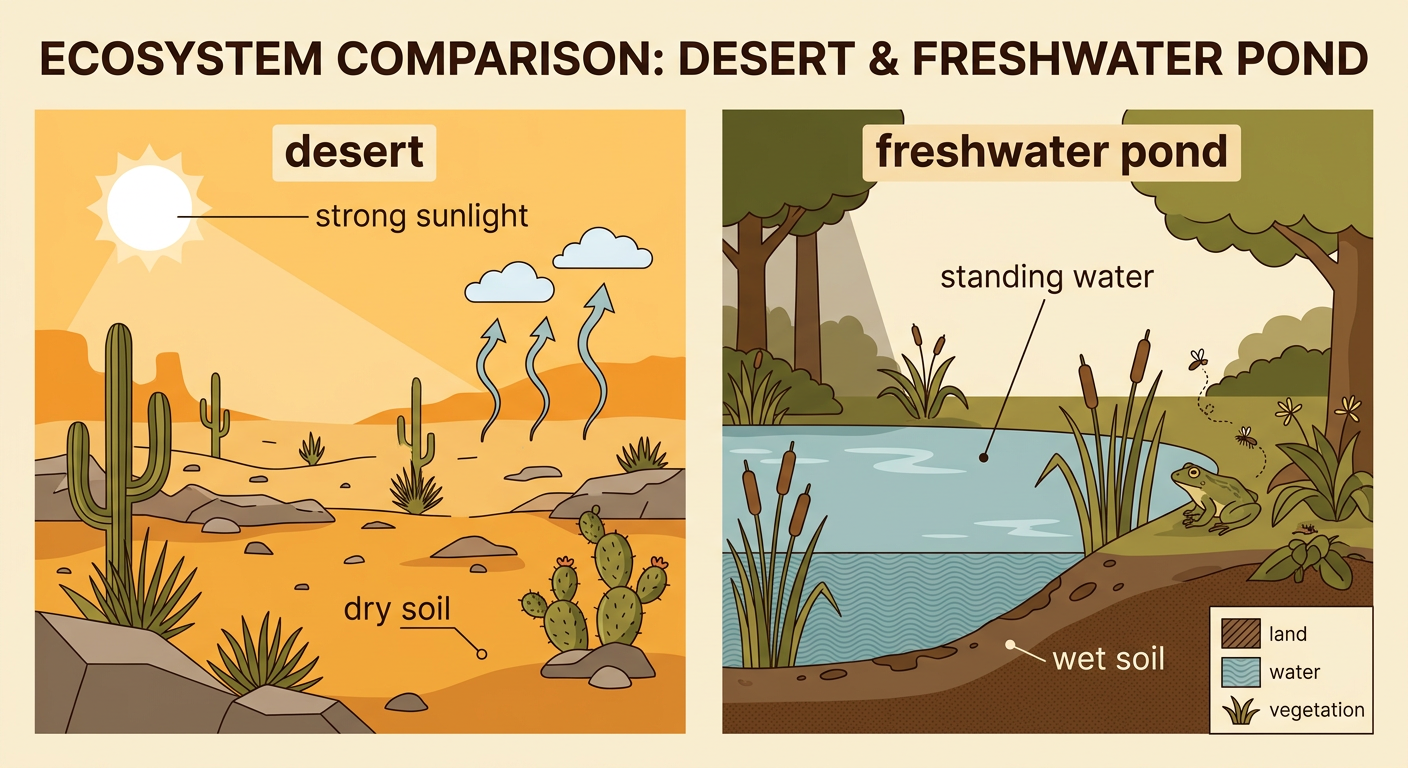
Compare a hot desert with a freshwater pond. The desert receives little rain and has dry, sandy or rocky soil. Strong sunlight causes water to evaporate quickly. Plants are spread apart, and many have ways to store or save water. A pond has standing freshwater, wet soil near its edge, and many water-loving plants. Its water and muddy shore provide places for animals to drink, feed, hide, and lay eggs. A geographic picture or map can help you notice where water, land, shade, and plants are located. For example, a cactus may find dry soil and strong sunlight in the desert. A frog may find water, insects, and shelter among plants at the pond. These observations are clues, but survival data can provide stronger evidence.
Read the Survival Data
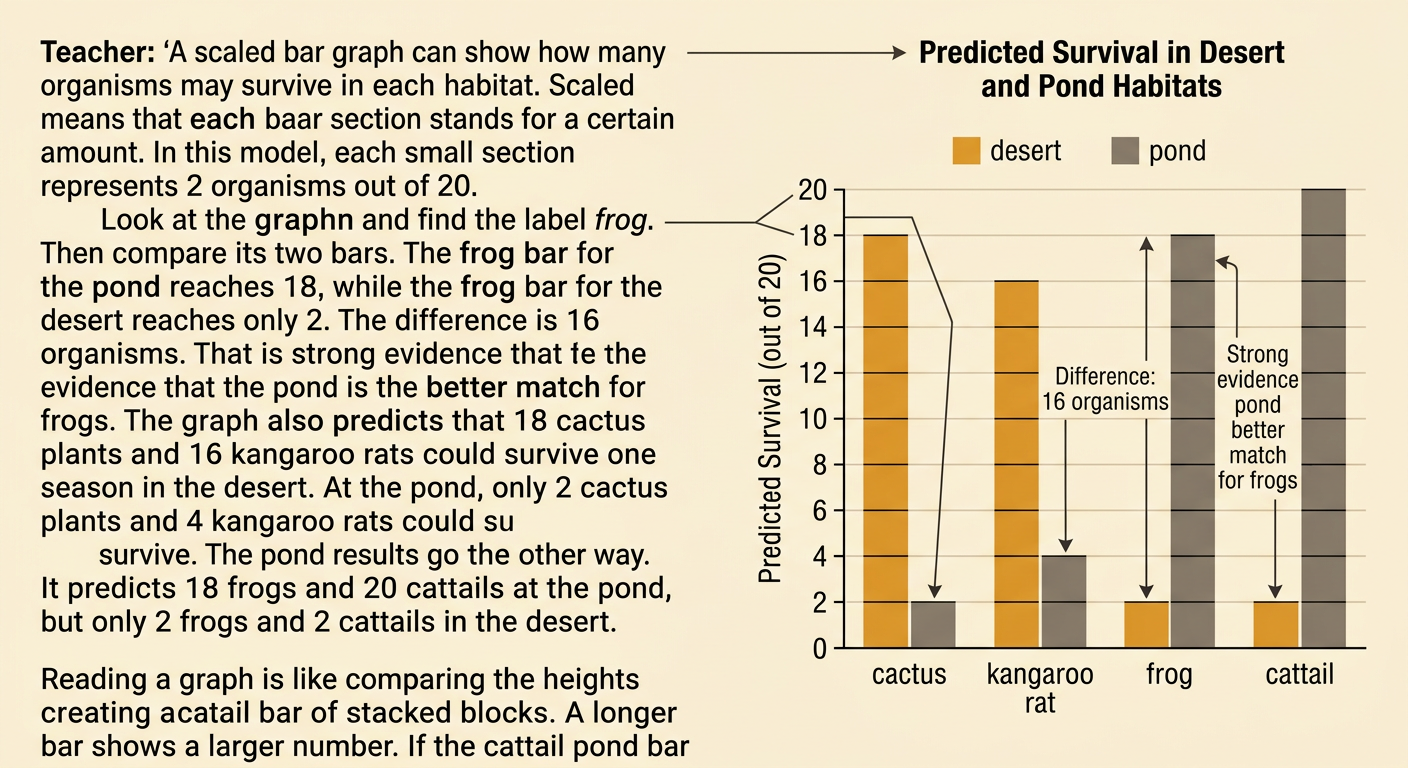
A scaled bar graph can show how well organisms may survive in each habitat. In this habitat model, each small bar section represents 2 organisms out of 20. The data predict that 18 cacti and 16 kangaroo rats could survive one season in the desert. Only 2 cacti and 4 kangaroo rats could survive at the pond. The pond results are different: 18 frogs and 20 cattails could survive there, compared with 2 frogs and 2 cattails in the desert. Read the habitat names along the bottom and the number of surviving organisms along the side. Compare bar lengths carefully. For example, the frog’s pond bar reaches 18, while its desert bar reaches 2. The difference is 16 organisms, which is evidence that the pond is the better match in this model.
Match Organisms to Habitats
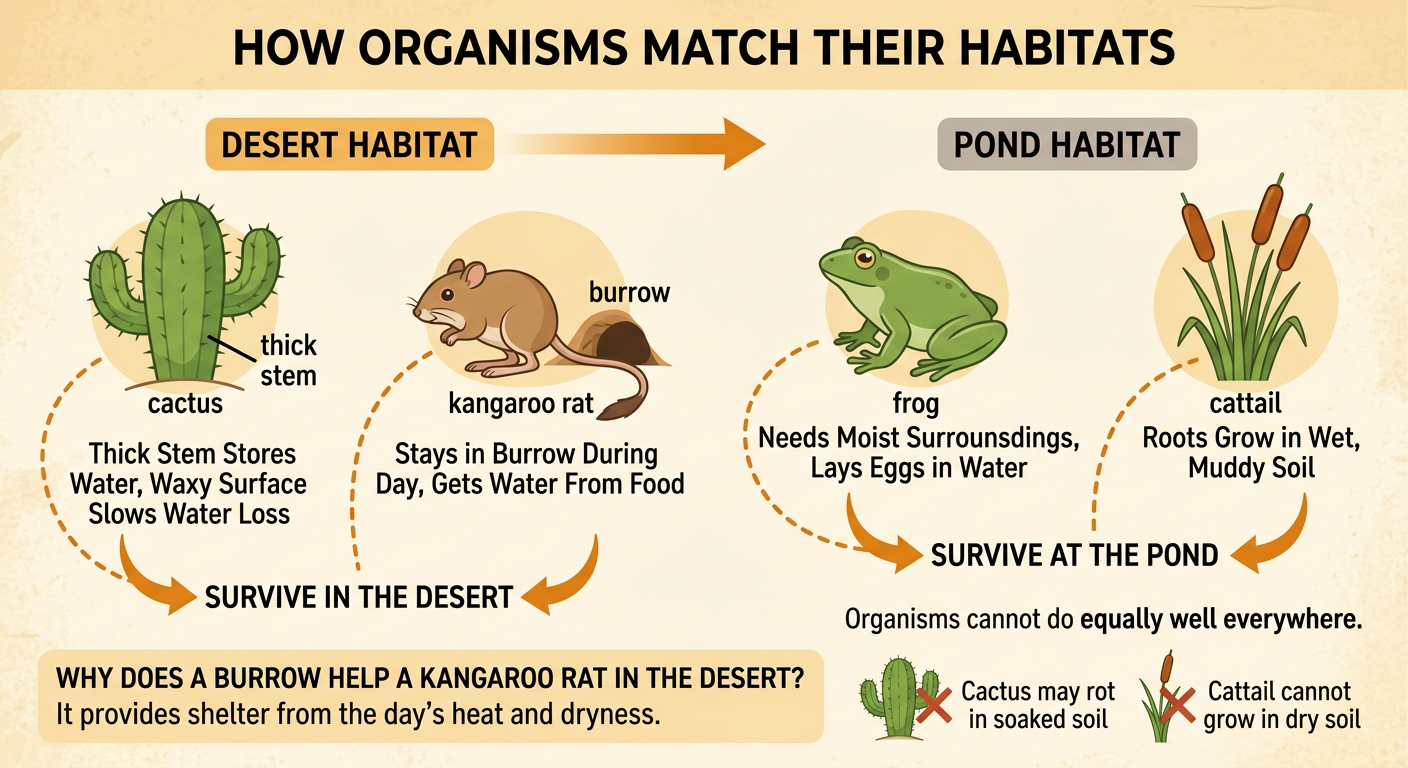
To match an organism to a habitat, connect its needs and body features to the habitat’s conditions. A cactus is a strong desert match because its thick stem stores water and its waxy surface slows water loss. A kangaroo rat also matches the desert because it shelters in a burrow during hot parts of the day and gets much of its water from food. A frog matches the pond because it needs moist surroundings and usually lays its eggs in water. A cattail matches the pond edge because its roots grow in wet, muddy soil. These organisms would not do equally well everywhere. For example, a cactus may rot in soil that stays soaked, while a cattail cannot grow well in very dry soil. A match must be supported by habitat clues and survival data.
Build an Evidence-Based Explanation
An evidence-based explanation has three parts: a claim, evidence, and reasoning. The claim answers which habitat is the better match. Evidence comes from the images, map, text, and graph. Reasoning explains how the evidence supports the claim. Here is an example: “A frog is more likely to survive well at the pond than in the desert. The pond has standing water, wet soil, insects, and plants for shelter. The graph predicts that 18 of 20 frogs survive at the pond, but only 2 survive in the desert. Frogs need moist conditions and water for their eggs, so the pond meets more of their needs.” This explanation uses both environmental observations and numerical data. Avoid saying only, “The frog belongs there.” Instead, name specific habitat features, compare graph values, and explain why those facts matter.
