Homeostasis: How Feedback Loops Regulate Blood Glucose
Students analyze blood-glucose data and model how insulin and glucagon create negative feedback loops that maintain stable internal conditions.

Illustrations are auto-generated and may be placeholders. They can be refreshed to match the narration.
Defining Homeostasis
Homeostasis is the process by which an organism maintains relatively stable internal conditions even when its environment or activities change. Stability does not mean that a variable remains at one exact value. Instead, variables such as body temperature, blood pH, and blood glucose usually fluctuate within a healthy range. Blood glucose is the concentration of glucose circulating in the blood. Cells use glucose as a major source of energy, but concentrations that are too high or too low can be harmful. For example, after a carbohydrate-rich breakfast, digested glucose enters the bloodstream and blood glucose rises. The body detects this change and activates responses that lower the concentration toward its usual range. During several hours without food, the body activates different responses that prevent blood glucose from falling too far.

Reading a Blood-Glucose Graph
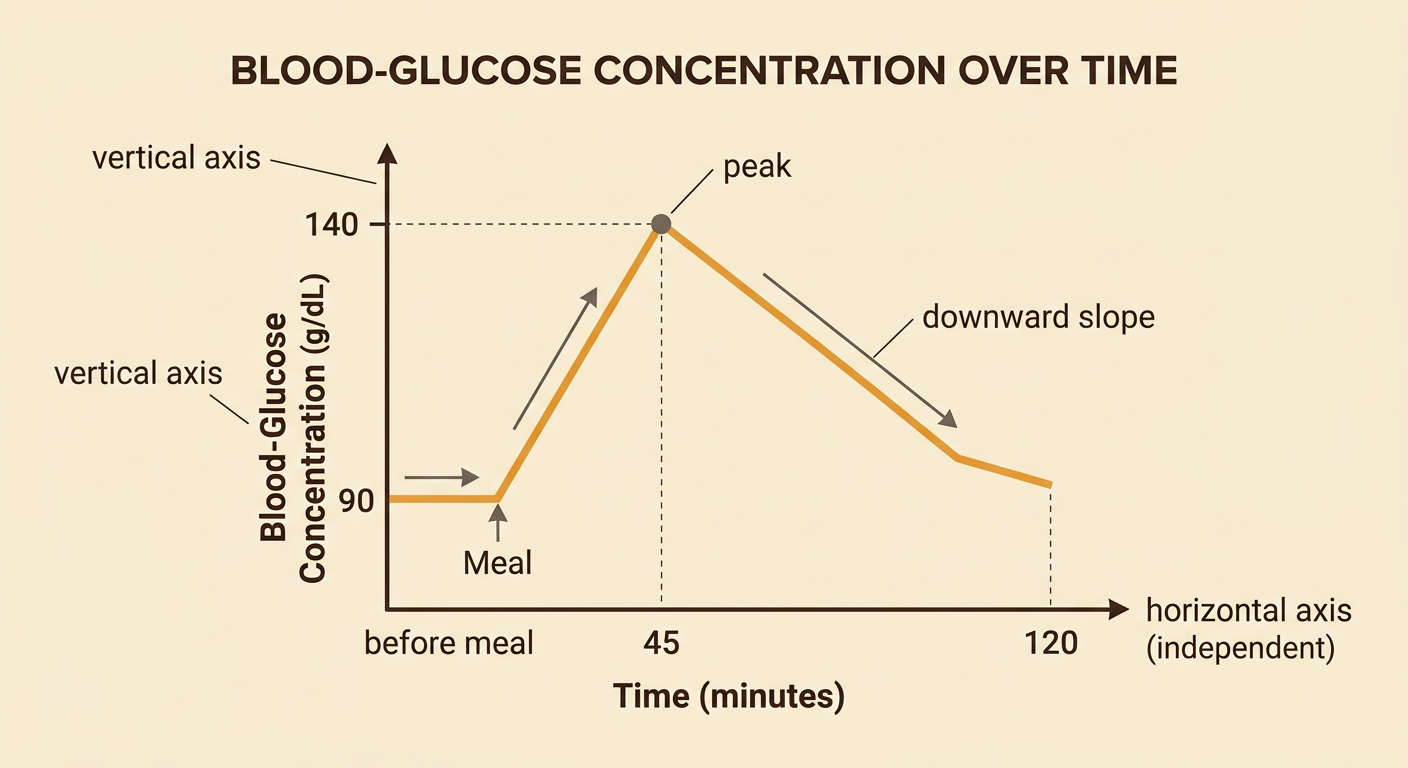
A blood-glucose graph shows how glucose concentration changes over time. Time is the independent variable on the horizontal axis, while blood-glucose concentration, often measured in milligrams per deciliter, is on the vertical axis. To interpret the graph, identify the starting value, peaks, low points, rates of change, and intervals when values are relatively stable. Suppose a person’s blood glucose is 90 mg/dL before a meal, rises to 140 mg/dL after 45 minutes, and returns near 95 mg/dL after two hours. The peak indicates when glucose concentration is greatest. The downward slope after the peak shows that glucose is leaving the blood faster than it is entering. A single graph can reveal a pattern, but repeated trials and information about meals, exercise, and health are needed before drawing broad conclusions.
Roles of Insulin and Glucagon
Insulin and glucagon are hormones produced by different cells in the pancreas. When blood glucose rises, pancreatic beta cells release insulin. Insulin signals many body cells, especially skeletal muscle and fat cells, to increase glucose uptake. It also promotes glucose storage as glycogen in the liver and muscles. Together, these actions lower blood glucose. When blood glucose falls, pancreatic alpha cells release glucagon. Glucagon acts mainly on the liver, stimulating glycogen breakdown and the production and release of glucose into the blood. These actions raise blood glucose. For example, insulin activity generally increases after a meal, while glucagon activity becomes more important between meals or during an overnight fast. The hormones have opposing effects, but both contribute to maintaining a usable glucose supply for cells.

Modeling a Negative Feedback Loop
A negative feedback loop opposes a change in a regulated condition. A blood-glucose model should include a stimulus, sensor and control center, signal, effectors, response, and reduced stimulus. After a meal, rising blood glucose is the stimulus. Beta cells in the pancreas detect the rise and release insulin. Target tissues respond by taking up or storing glucose, so blood glucose falls and insulin release decreases. During fasting, falling blood glucose stimulates alpha cells to release glucagon. The liver then releases glucose, so blood glucose rises and glucagon release decreases. Students can investigate this model by comparing time-series data after a meal, after exercise, and during fasting. They should predict the direction of hormone change, graph the data, and evaluate whether each response moves blood glucose toward its starting range. Evidence of that return supports the feedback model.

Explaining Diabetes as Feedback Disruption
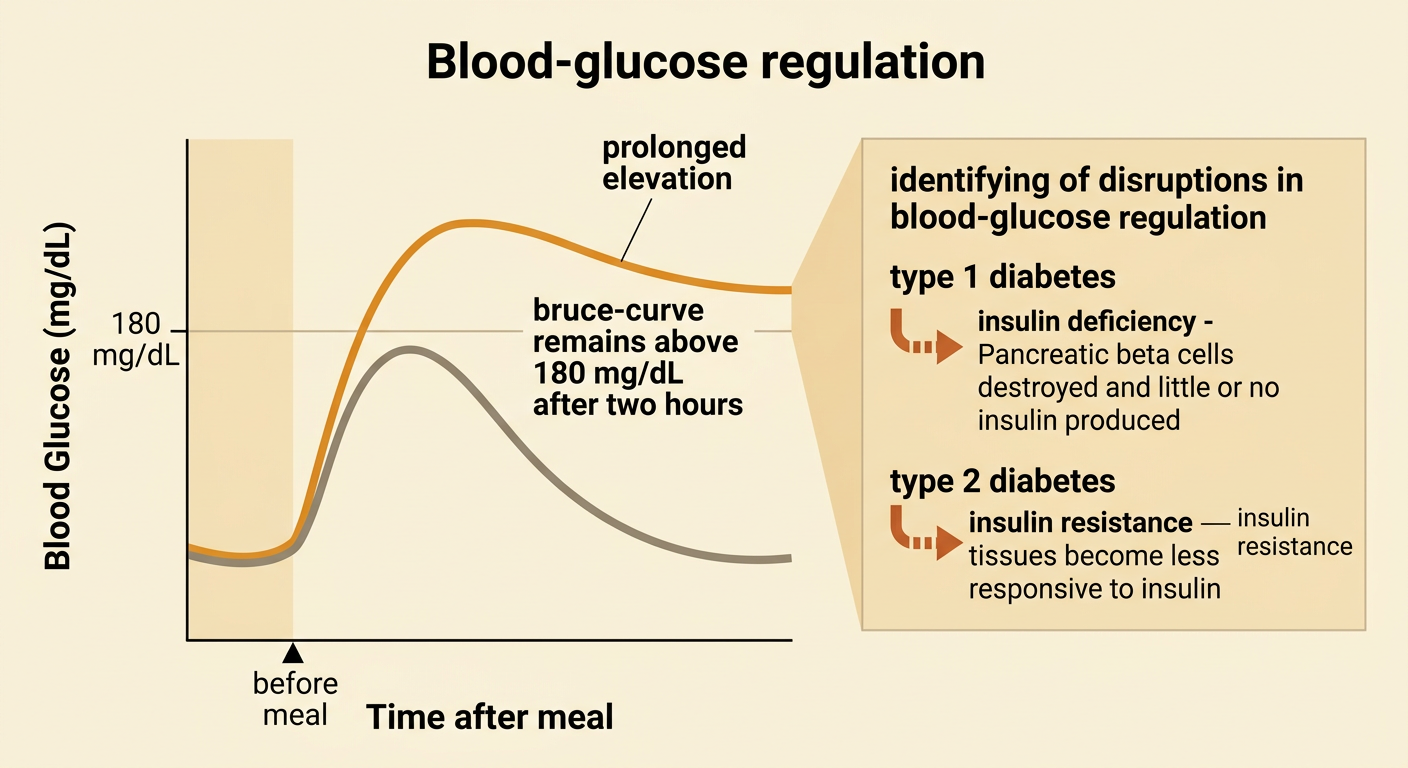
Diabetes mellitus occurs when blood-glucose regulation is disrupted, producing persistent or repeated high blood glucose. In type 1 diabetes, an autoimmune process destroys pancreatic beta cells, so the body produces little or no insulin. In type 2 diabetes, body tissues become less responsive to insulin, and insulin production may also decline over time. After a meal, glucose can therefore remain elevated longer than expected because uptake and storage are impaired. A strong explanation should connect evidence to the feedback model. For example, if two data sets show similar starting values but one remains above 180 mg/dL after two hours, the prolonged elevation may support a claim of impaired regulation. However, one graph alone cannot diagnose diabetes. Meal size, stress, medication, activity, measurement error, and individual variation are alternative factors. Reliable arguments use repeated measurements, clinical tests, and multiple sources while acknowledging these limitations.