How Fast Do Liquids Flow?
Students compare water, cooking oil, and syrup to discover that liquids can flow at different speeds because they have different observable properties.

Illustrations are auto-generated and may be placeholders. They can be refreshed to match the narration.
Meet the Three Liquids
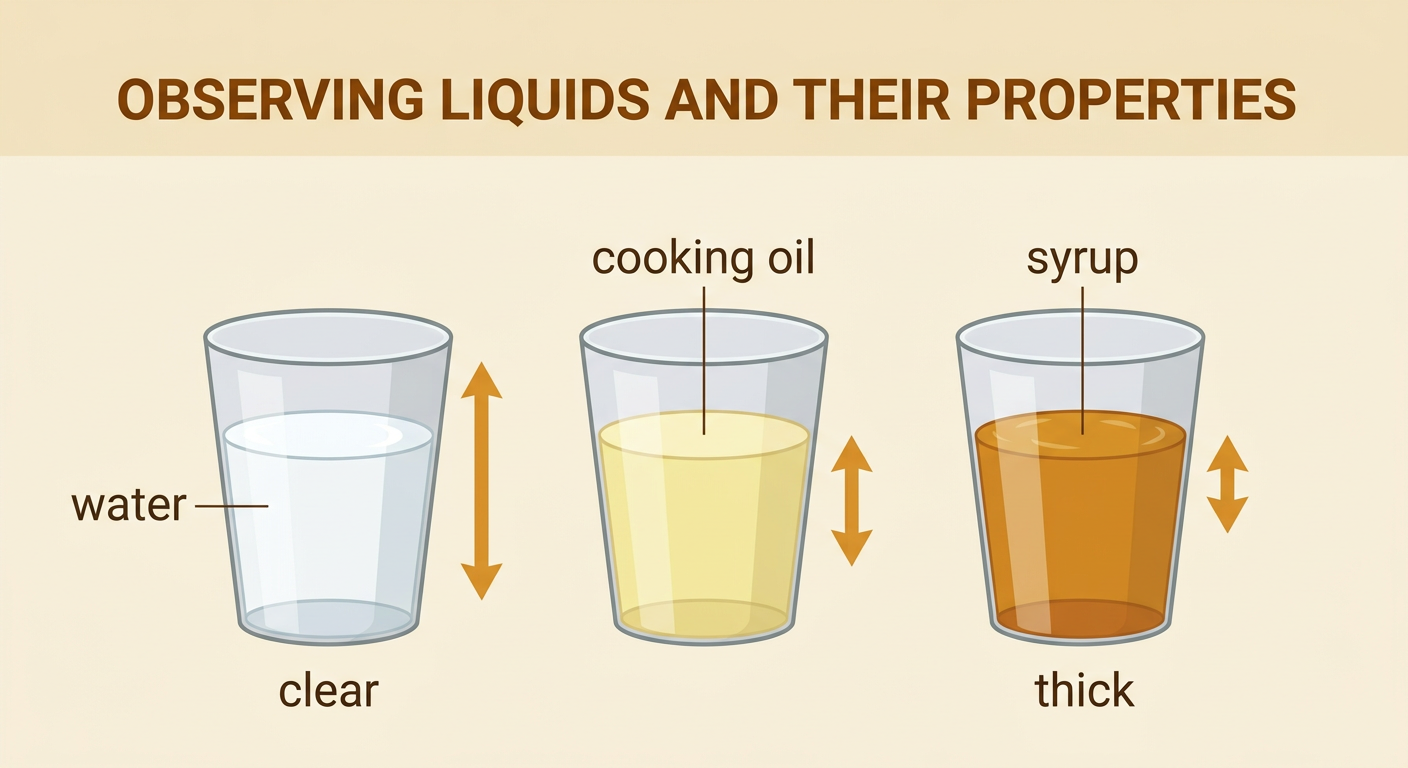
Water, cooking oil, and syrup are all liquids. A liquid can move, flow, and take the shape of its container. However, these three liquids do not look or move exactly alike. Water looks clear and pours easily. Cooking oil may look pale yellow and feels slippery if an adult allows you to touch a drop. Syrup often looks thick and moves slowly when its container is tilted. We can observe these properties by looking carefully and watching each liquid move. For example, water quickly spreads across a plate, while a drop of syrup may stay in a small mound longer. Scientists use observations to describe and sort materials. During this investigation, do not taste any liquid. Talk with your group about what you notice, and listen as others share their observations.
Predict Which Will Flow Fastest
Before testing, make a prediction about which liquid will reach the finish line first. A prediction is what you think will happen based on what you observe or already know. Look at each liquid as the teacher gently tilts its cup. Which one begins moving right away? Which one seems thick and slow? You might predict, “I think water will flow fastest because it moved easily when the cup tilted.” Another student may have a different idea. Take turns speaking, ask questions, and listen closely to your group members. Record one prediction for each person or make a class picture graph with three choices: water, oil, and syrup. Count how many students chose each liquid. A prediction does not have to be correct. The test will provide evidence that helps the class learn.

Conduct a Safe Flow Test
Use three identical smooth ramps or trays. Mark the same start line and finish line on each ramp. With adult help, place the same amount of water, oil, and syrup at the start lines. The ramps must have the same height and angle so the test is fair. Release the liquids at the same time by lifting three small cards that hold them in place. Watch each liquid flow toward the finish line. An adult can use a timer to count how many seconds each liquid takes to arrive. For example, if water reaches the line before oil and syrup, water flowed fastest in that test. Keep hands away while the liquids move. Never taste the materials, and wipe up spills right away with adult help. Repeat the test to check whether the pattern happens again.

Record and Compare Results
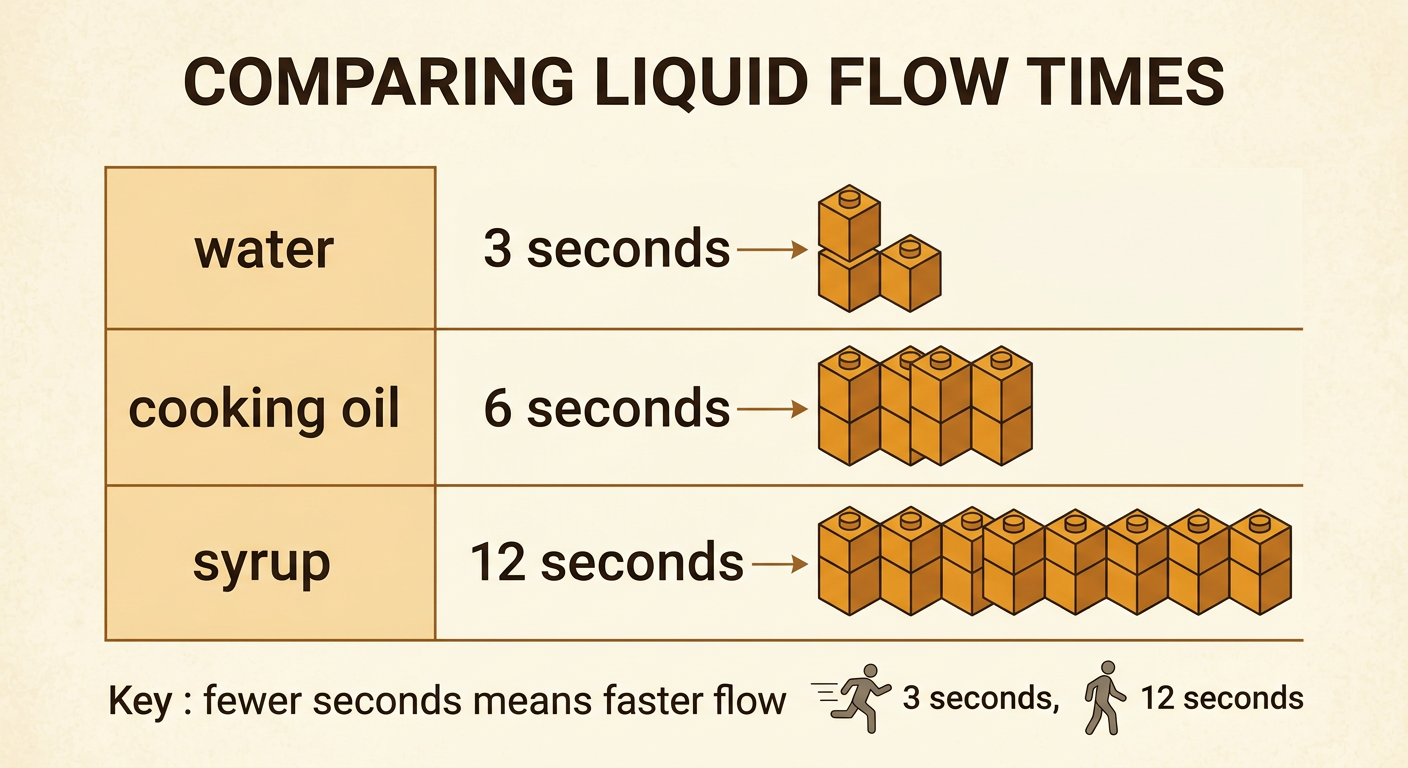
Record what happened so the class can compare the three liquids. Make a table with one row for water, one for cooking oil, and one for syrup. Write or draw how many seconds each liquid took to reach the finish line. Fewer seconds means faster flow, and more seconds means slower flow. In one example test, water might take 3 seconds, oil 6 seconds, and syrup 12 seconds. These are example numbers; your results may be different. You can also make a picture graph or use connecting cubes to show the times. Compare the rows by asking, “Which liquid was fastest? Which was slowest? How many more seconds did one take than another?” Look for a pattern across repeated tests. Careful records help scientists remember observations and use data as evidence.
Share an Evidence-Based Claim
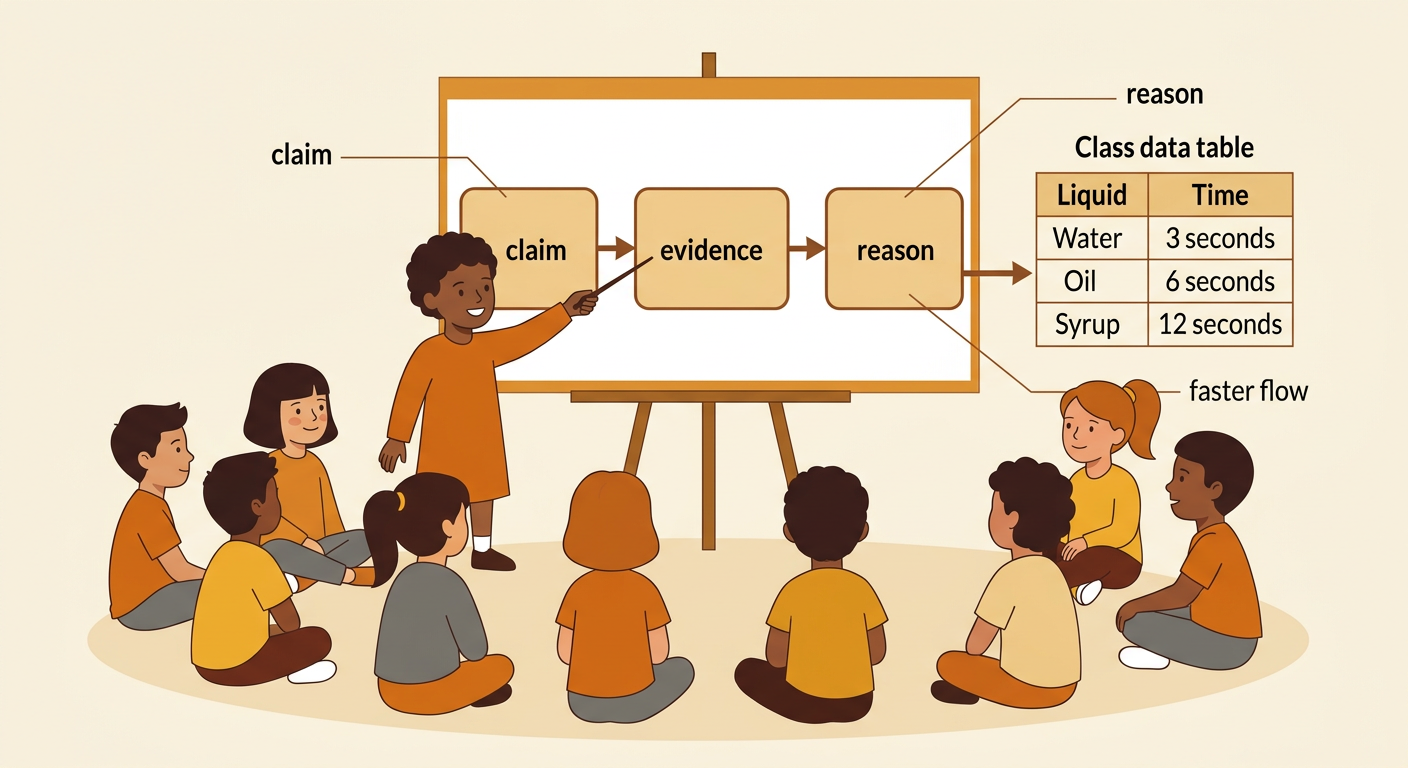
A claim tells what you learned. Evidence is an observation or a result that supports the claim. A reason explains how the evidence supports it. Use your group’s data, not only your prediction. You might say, “I claim that water flowed fastest in our test. Water reached the finish line in 3 seconds, while oil took 6 seconds and syrup took 12 seconds. A smaller time means faster flow, so the data support my claim.” Your class results may show different times, so use the numbers you actually recorded. Take turns sharing, and listen respectfully when classmates speak. Ask questions such as, “What evidence supports your claim?” Together, discuss how the liquids’ observable properties matched their movement. In this setup, a thicker liquid may flow more slowly than a thinner liquid. Scientists make claims that can be checked with evidence.