How Many Deer Can the Habitat Support?
Students analyze a deer population graph to identify carrying capacity and explain how resource availability and human land-use decisions affect population size.
Illustrations are auto-generated and may be placeholders. They can be refreshed to match the narration.
Carrying Capacity Quick Start
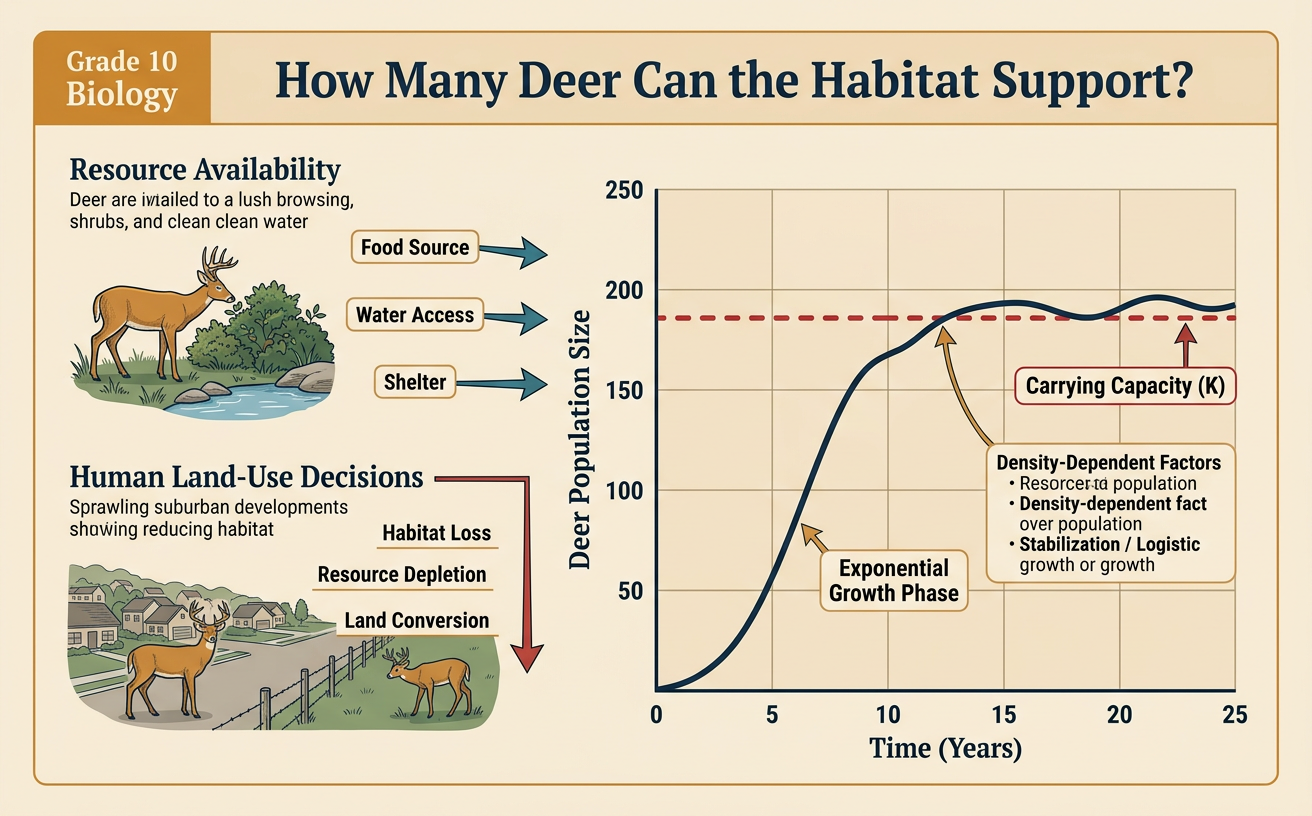
Carrying capacity is the largest population an environment can support over time with its available resources and conditions. It is often represented by K. Imagine a forest that regularly provides enough food, water, shelter, and space for about 80 deer. If the population is below 80, births and immigration may cause it to grow. If the population rises above 80, competition increases, and deaths or emigration may bring the population back down. Carrying capacity is not a fixed number forever. A drought can reduce plant growth and lower K, while habitat restoration can increase food or shelter and raise K. Scientists estimate carrying capacity by examining population data and evidence about resources rather than by selecting the highest population ever recorded.

Read the Deer Population Graph
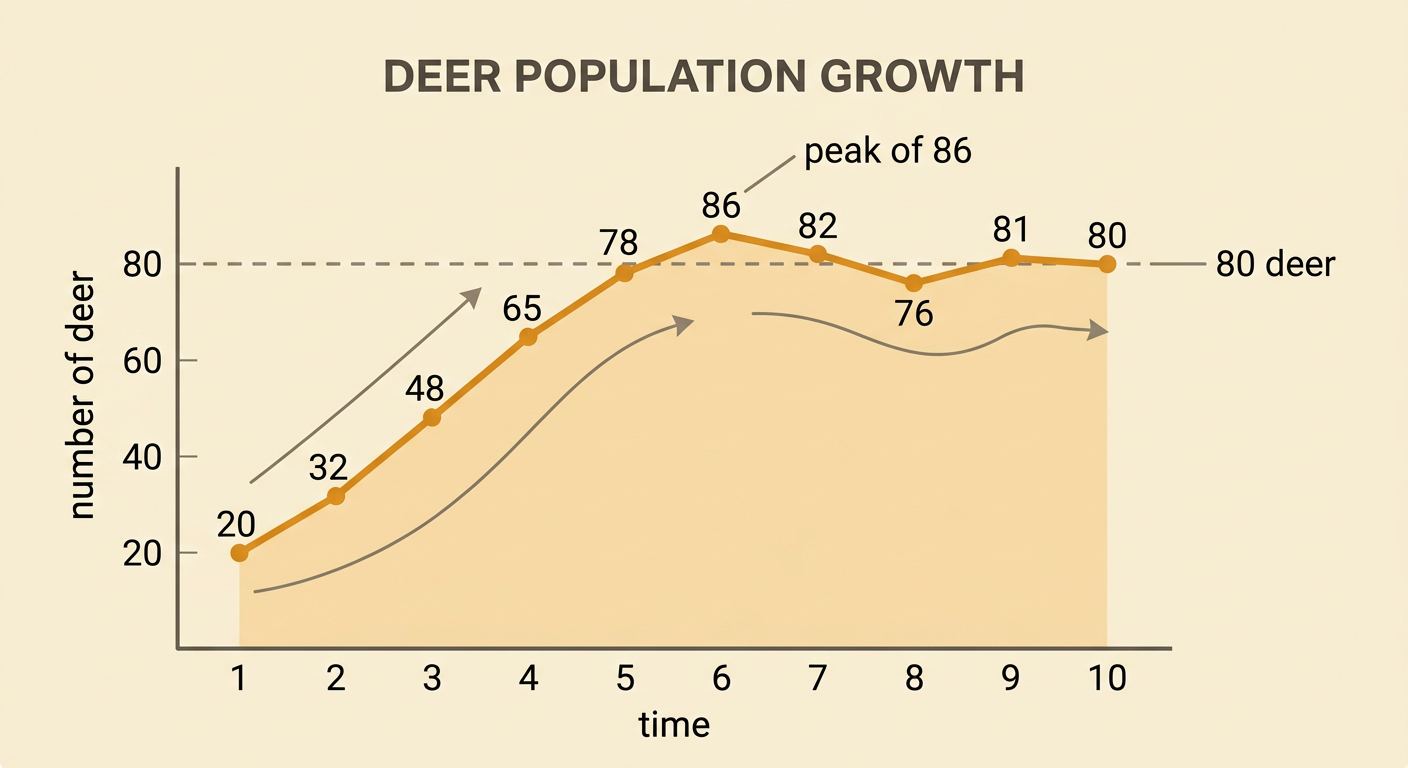
A population graph displays time on the horizontal axis and the number of deer on the vertical axis. Consider a graph with yearly populations of 20, 32, 48, 65, 78, 86, 82, 76, 81, and 80 deer. The curve rises rapidly at first, then fluctuates near 80. The peak of 86 is not necessarily the carrying capacity because the habitat may not sustain that number. Instead, the repeated values around 80 suggest that K is approximately 80 deer. Describe both the overall trend and important changes: the population increases from years 1 through 6, decreases after exceeding 80, and then levels off with small fluctuations. This translates the graph's quantitative pattern into a biological explanation.
Identify Limiting Factors
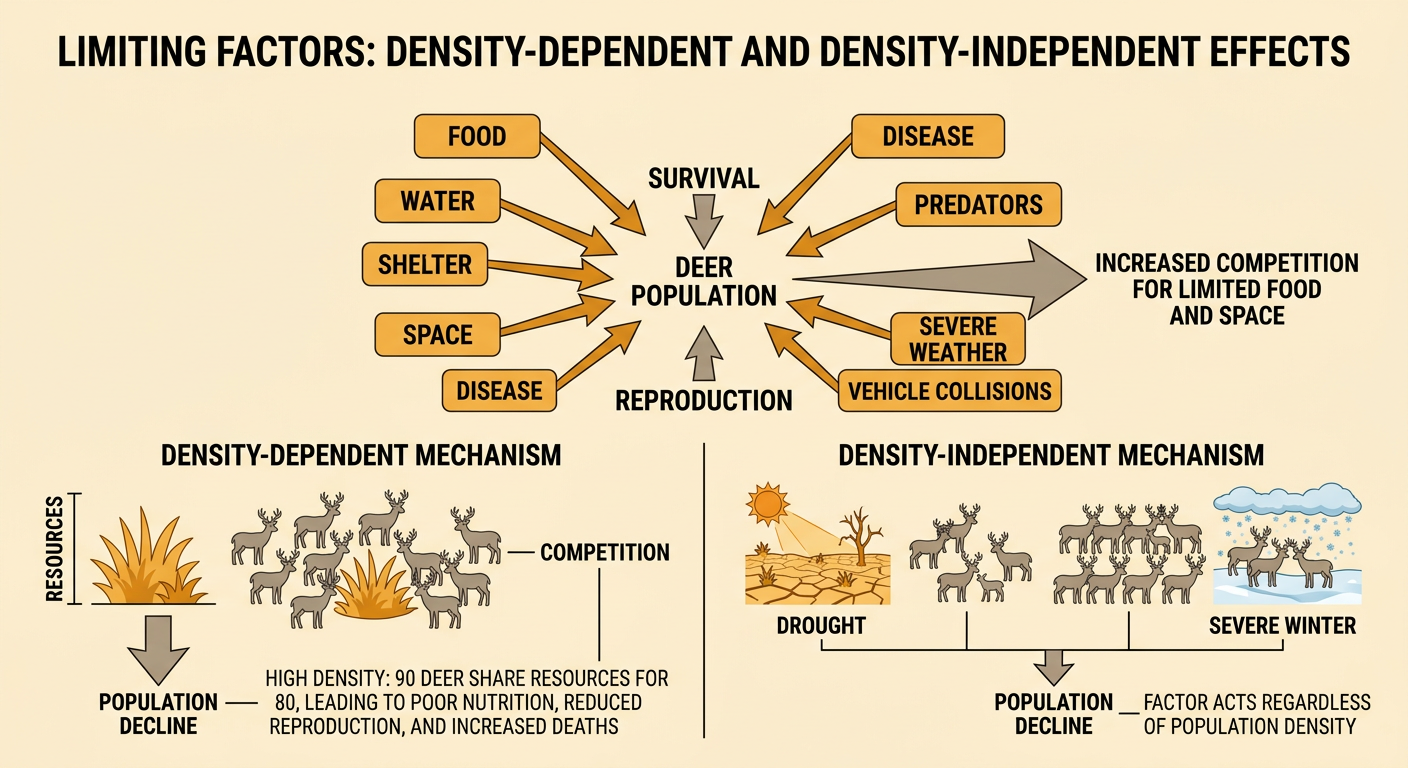
Limiting factors are resources or conditions that restrict population growth. For deer, common limiting factors include food, water, shelter, space, disease, predators, severe weather, and vehicle collisions. Some become stronger as population density rises. For example, when 90 deer compete for vegetation that usually supports about 80, each deer may obtain less food. Poor nutrition can reduce reproduction and increase deaths, causing the population to decline. Other factors, such as a severe winter or drought, can affect a population even when density is low. To explain a graph correctly, connect evidence to a mechanism. A decline after a drought could result from reduced plant growth, but the graph alone cannot prove drought was the cause. Weather, vegetation, disease, and mortality data would strengthen the explanation.
Evaluate a Land-Use Scenario
Suppose a 1,000-acre forest supports about 80 deer, but a housing development removes 250 acres. If habitat quality is equal across the forest, a simple proportional model predicts a new carrying capacity of 80 × 750 ÷ 1,000, or 60 deer. However, land-use effects may be greater than the area calculation suggests. Roads and buildings can divide the remaining forest into isolated patches, reduce access to water, increase vehicle collisions, and create more forest edge. Cultural choices also matter: planners might preserve a wildlife corridor, cluster homes away from wetlands, or restore native vegetation. These decisions could keep more habitat connected and reduce the decline in carrying capacity. The estimate of 60 deer is therefore a useful starting point, not a guaranteed outcome.

Explain and Defend a Prediction
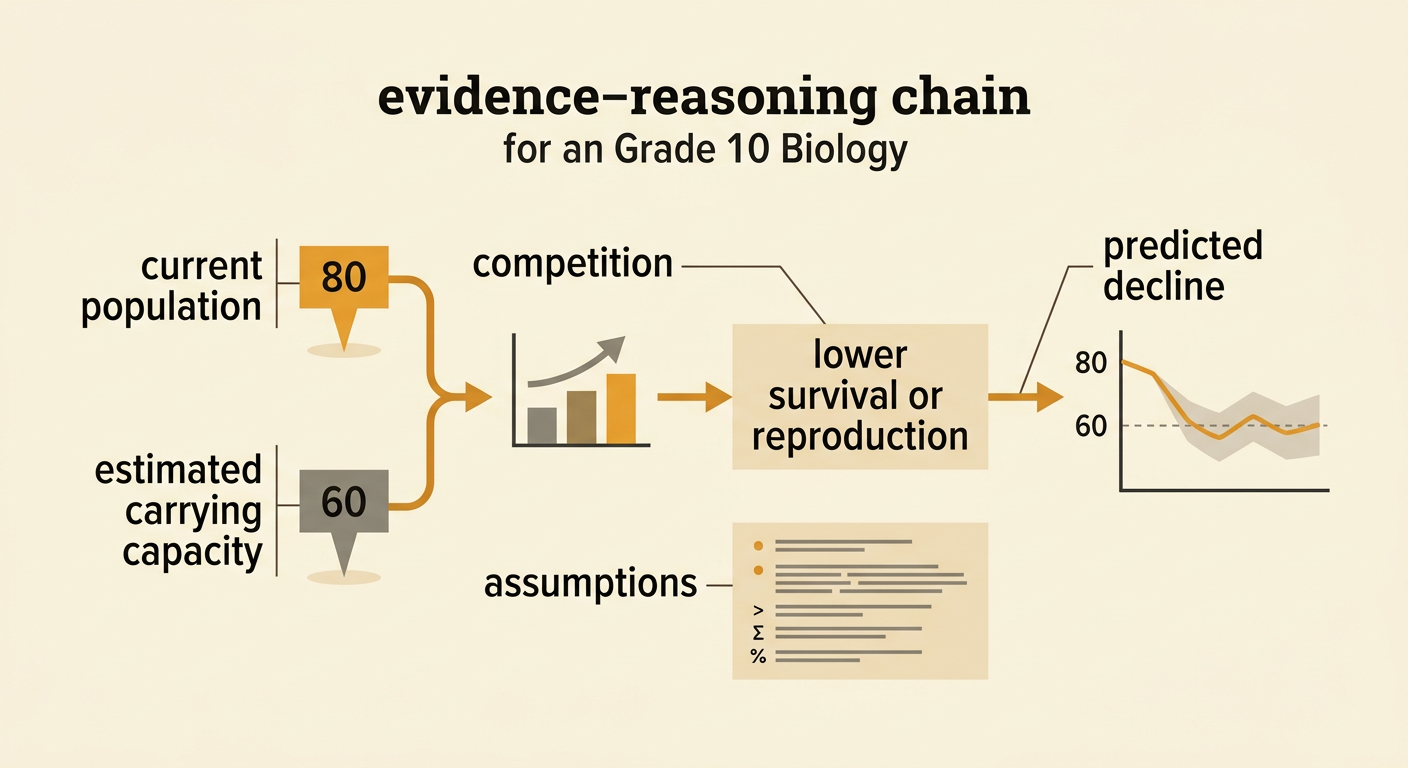
A strong prediction states what will happen, supports it with calculations and graph evidence, and identifies assumptions. For example: If development reduces the estimated carrying capacity from 80 to about 60 deer while the current population remains 80, the population will probably decline during the next several years and then fluctuate near 60. The habitat would have fewer resources per deer, increasing competition and lowering survival or reproduction. This prediction assumes the remaining acres have similar habitat quality and that migration, hunting, disease, and weather do not change greatly. Fragmentation could push the population below 60, while a protected corridor and restored vegetation could keep it closer to 60 or raise it later. Defend the prediction by citing the proportional calculation, the earlier graph pattern, and evidence about resource availability.