
How Mass and Speed Affect Kinetic Energy
Students interpret tables and graphs from model-object trials to determine how an object's mass and speed affect its kinetic energy.
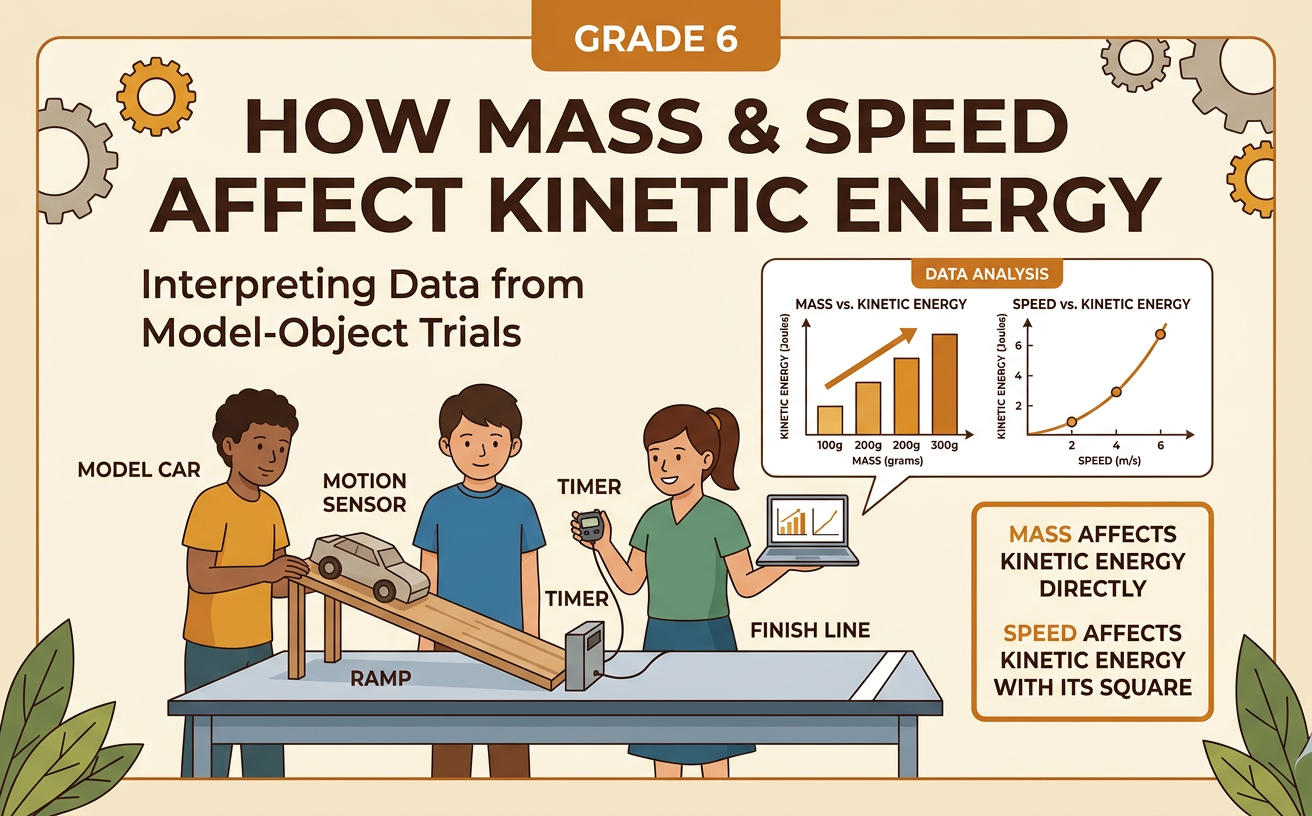
Illustrations are auto-generated and may be placeholders. They can be refreshed to match the narration.
Kinetic Energy in Moving Objects
Kinetic energy is the energy an object has because it is moving. It depends on the object’s mass and speed. Scientists calculate kinetic energy with the equation KE = 1/2 × mass × speed². Mass is measured in kilograms, speed in meters per second, and kinetic energy in joules. For example, a 2-kilogram model cart moving at 3 meters per second has 9 joules of kinetic energy: 1/2 × 2 × 3² = 9. If the cart stops, its speed becomes zero, so its kinetic energy also becomes zero. During a trial, students can measure a model object’s mass and speed, calculate its kinetic energy, and record all three quantities in a table. These data help reveal patterns among mass, speed, and kinetic energy.

Comparing Objects with Different Masses
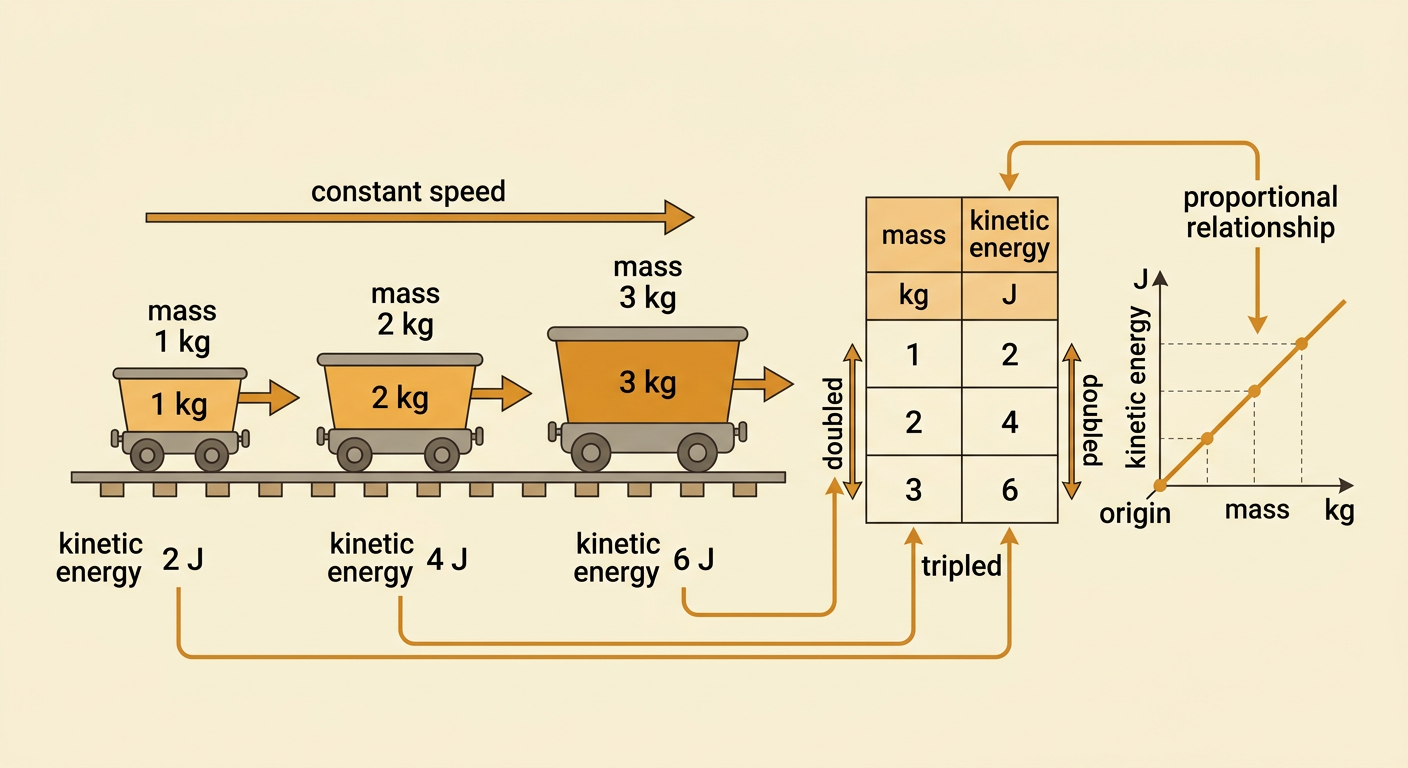
To test how mass affects kinetic energy, keep speed the same and change only mass. Imagine three model carts moving at 2 meters per second. A 1-kilogram cart has 2 joules of kinetic energy, a 2-kilogram cart has 4 joules, and a 3-kilogram cart has 6 joules. The table shows that adding equal amounts of mass adds equal amounts of kinetic energy when speed stays constant. Doubling mass from 1 kilogram to 2 kilograms doubles kinetic energy from 2 joules to 4 joules. Tripling mass triples kinetic energy. This is a proportional relationship, so a graph of kinetic energy against mass forms a straight line through the origin. A fair comparison requires the carts to travel at the same speed; otherwise, students cannot tell whether mass or speed caused the difference.
Comparing Objects at Different Speeds
To investigate speed, keep mass constant and change only speed. Consider a 2-kilogram cart. At 1 meter per second, it has 1 joule of kinetic energy. At 2 meters per second, it has 4 joules, and at 3 meters per second, it has 9 joules. These values increase as 1², 2², and 3² because speed is squared in the kinetic energy equation. Doubling the cart’s speed from 1 to 2 meters per second makes its kinetic energy four times as great, not twice as great. Tripling its speed makes the energy nine times as great. This means speed has a stronger effect on kinetic energy than the same proportional change in mass. The cart’s mass must remain unchanged during these trials so that the results isolate the effect of speed.

Reading Kinetic Energy Graphs
A graph can make patterns in trial data easier to see. First, read the axis labels and units. The horizontal axis shows the quantity that was changed, such as mass or speed. The vertical axis shows kinetic energy in joules. When speed is constant, a kinetic-energy-versus-mass graph is a straight line through the origin. When mass is constant, a kinetic-energy-versus-speed graph curves upward because kinetic energy depends on speed squared. For example, points for a 2-kilogram cart may appear at 1 meter per second and 1 joule, 2 meters per second and 4 joules, and 4 meters per second and 16 joules. Check the scale before reading a point; each grid interval may represent more than one unit. Use both the graph and the data table to confirm conclusions.

Making an Evidence-Based Claim
An evidence-based argument includes a claim, relevant evidence, and reasoning that connects them. A student might claim, “Doubling speed affects kinetic energy more than doubling mass.” Suppose a 1-kilogram cart moving at 2 meters per second has 2 joules of kinetic energy. Doubling its mass while keeping speed constant produces 4 joules. Doubling its speed while keeping mass constant produces 8 joules. These data support the claim because doubled mass doubles kinetic energy, while doubled speed quadruples it. The equation also explains the pattern because mass is multiplied once but speed is squared. A strong argument identifies limitations. For example, a motion sensor may round speed measurements, or friction may cause a cart’s speed to change. Repeated trials and careful control of variables strengthen the evidence, but results should not be presented as perfectly exact.
