
How Temperature Affects Dissolving Rate
Students conduct a fair test to determine how water temperature affects the time required for equal amounts of sugar to dissolve.
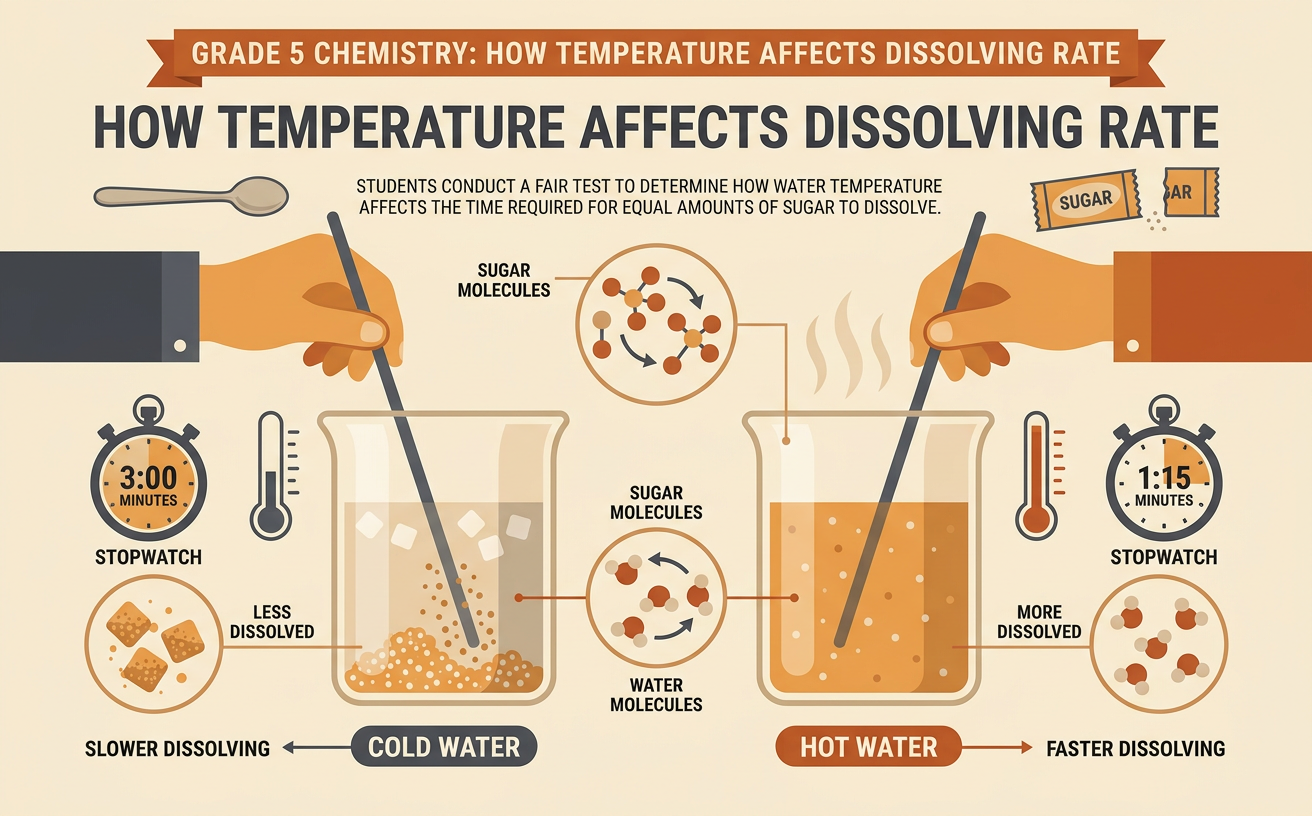
Illustrations are auto-generated and may be placeholders. They can be refreshed to match the narration.
Dissolving Rate Question
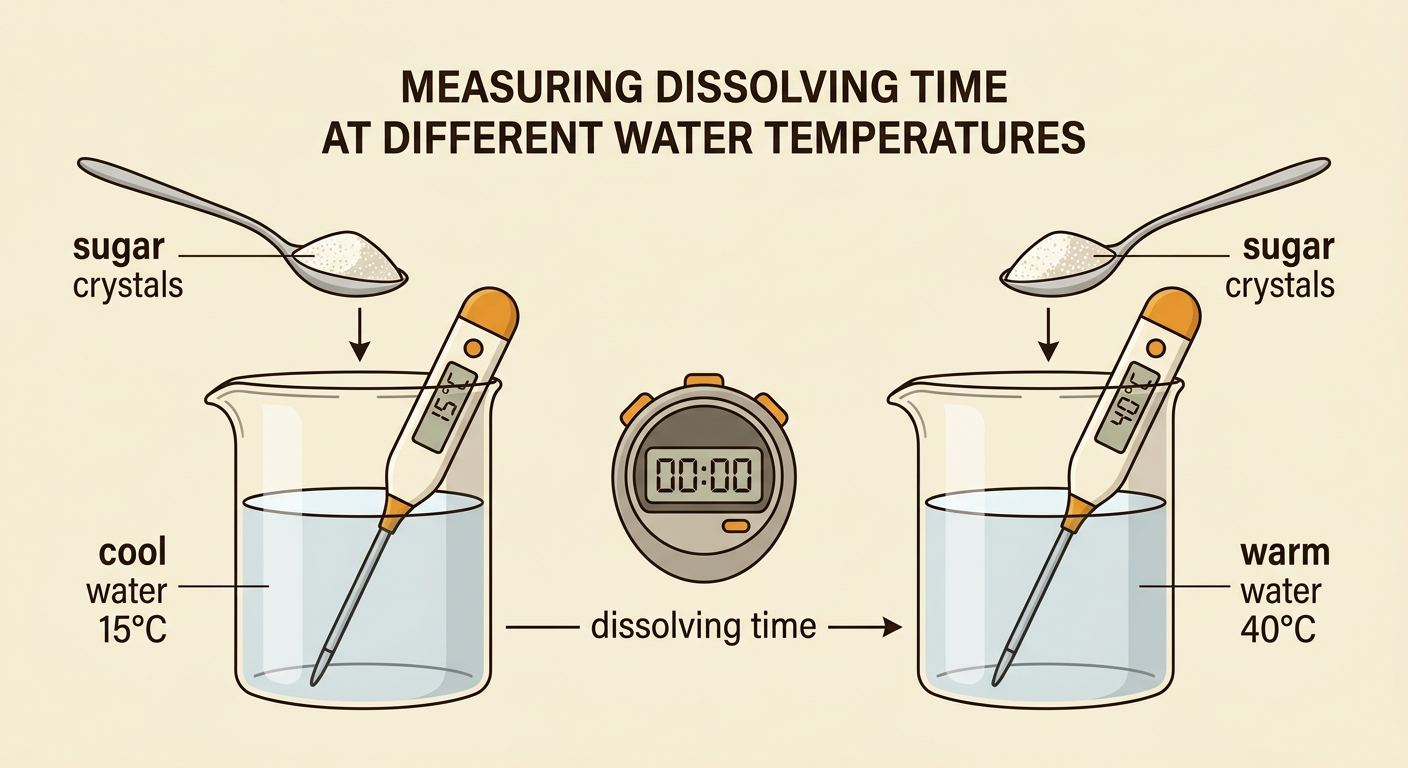
When sugar dissolves, its tiny particles spread throughout the water. The sugar has not disappeared, and it has not changed into a new substance. Dissolving rate describes how quickly this process happens. Our investigation asks, “How does water temperature affect the time required for sugar to dissolve?” For example, one cup might contain cool water at 15°C, while another contains warm water at 40°C. Each cup receives the same amount of sugar. We predict which sample will dissolve first, but a prediction is not a conclusion. We must collect measurements before answering the question. The dissolving time begins when sugar enters the water and ends when no sugar crystals can be seen at the bottom after stirring.
Variables and Fair-Test Plan
A fair test changes only one variable at a time. The independent variable, which we purposely change, is water temperature. The dependent variable, which we measure, is the time for the sugar to dissolve. Everything else should be controlled. Use identical cups, 100 milliliters of water, 10 grams of the same sugar, and the same type of spoon. Stir each sample at the same steady rate, such as one complete circle every second. Measure temperature with a thermometer instead of guessing. Use warm water that an adult has approved, not boiling water. For example, testing water at 15°C and 40°C is fair only if the sugar amount, water volume, cup, and stirring method remain the same.

Warm- and Cold-Water Trials
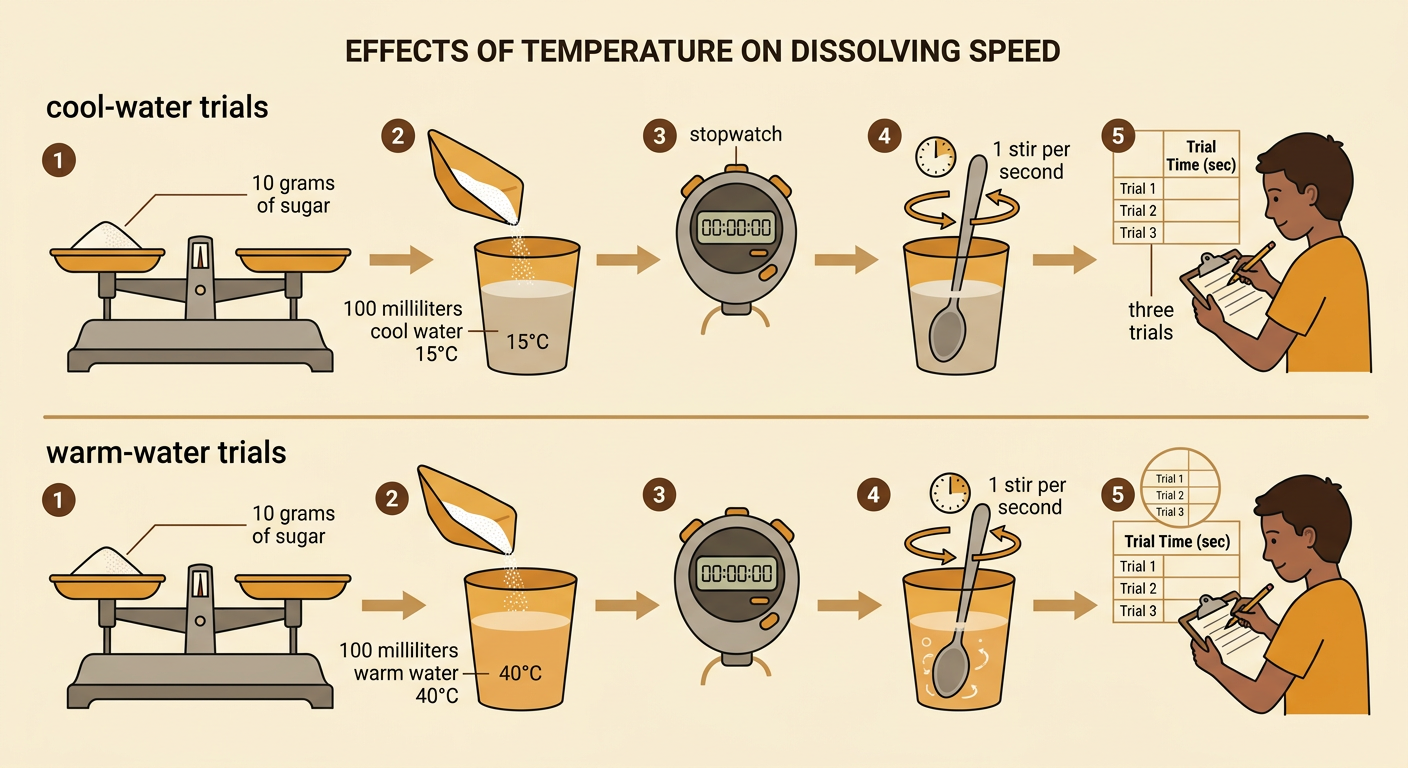
Prepare one cup with 100 milliliters of cool water at 15°C and another with 100 milliliters of warm water at 40°C. Measure 10 grams of sugar for each cup. Add the sugar to the cool water and start the stopwatch immediately. Stir one complete circle each second. Stop timing when no crystals remain visible at the bottom. Record the time, rinse the cup, and repeat the procedure. Follow the same steps with the warm water. Complete at least three trials at each temperature because one trial may include a timing or stirring difference. For example, if a spoon pauses during a trial, note the problem and repeat that trial rather than quietly changing the result. Careful, repeated procedures make the evidence more dependable.
Record and Compare Times
Organize the results in a table so the two temperatures are easy to compare. Suppose the cool-water times are 96, 90, and 93 seconds. Their mean is 93 seconds because 96 plus 90 plus 93 equals 279, and 279 divided by 3 equals 93. Suppose the warm-water times are 46, 42, and 44 seconds. Their mean is 44 seconds. The difference between the means is 49 seconds, so the sugar dissolved 49 seconds sooner in warm water. A bar graph can represent these means, with temperature on the horizontal axis and mean dissolving time on the vertical axis. Shorter times indicate faster dissolving. Combining results from several groups can reveal whether the same pattern appears repeatedly.

Claim, Evidence, and Explanation
Use a claim, evidence, and explanation to answer the investigation question. A claim based on the example results is, “Sugar dissolved faster in warm water than in cool water.” Evidence should include measurements: the mean time was 44 seconds at 40°C and 93 seconds at 15°C, a difference of 49 seconds. In the explanation, connect the evidence to science. Water particles move faster at higher temperatures and collide with the sugar more often and with more energy, helping sugar particles separate and spread through the water more quickly. Results from repeated trials or other groups make the argument stronger if they show a similar pattern. Limit the claim to the tested conditions because other temperatures, amounts, or stirring rates were not investigated.
