How Water and Wind Shape Land
Students use photographs, maps, diagrams, and measurement data to explain how weathering and erosion change Earth’s surface.

Illustrations are auto-generated and may be placeholders. They can be refreshed to match the narration.
Notice Changes in Landform Photographs
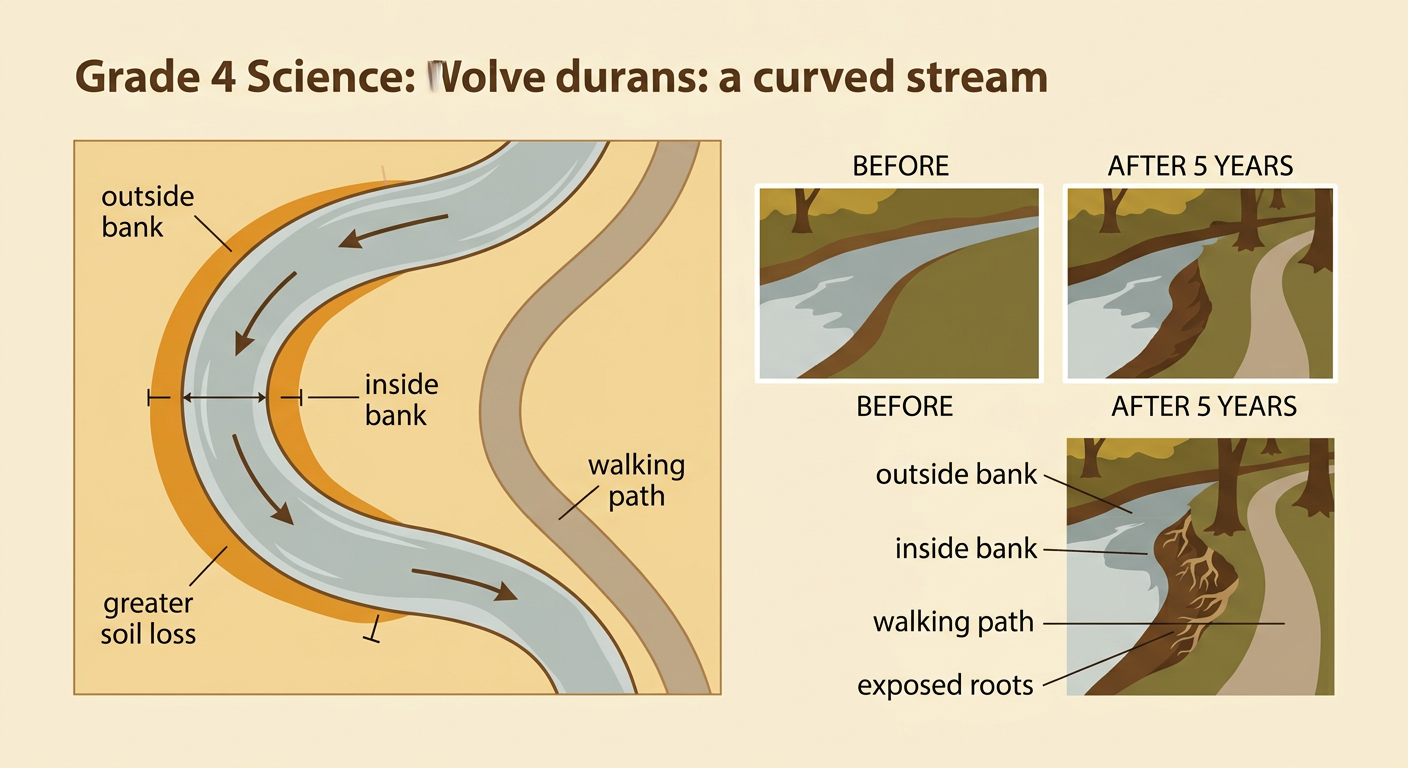
Photographs taken from the same place at different times can reveal how land changes. First, look for features that appear in both images, such as a tree, road, cliff, or bend in a river. These matching features help you compare locations accurately. Then notice differences in the shape, height, or position of soil and rock. For example, an older photograph may show a wide, grassy riverbank, while a newer photograph shows a narrow bank with exposed roots. This is evidence that soil was removed. A map can add information by showing that the bank is beside a fast-moving river. Record only what you can observe before making an explanation. “The bank became narrower” is an observation. “Flowing water carried soil away” is an evidence-based explanation.

Distinguish Weathering from Erosion
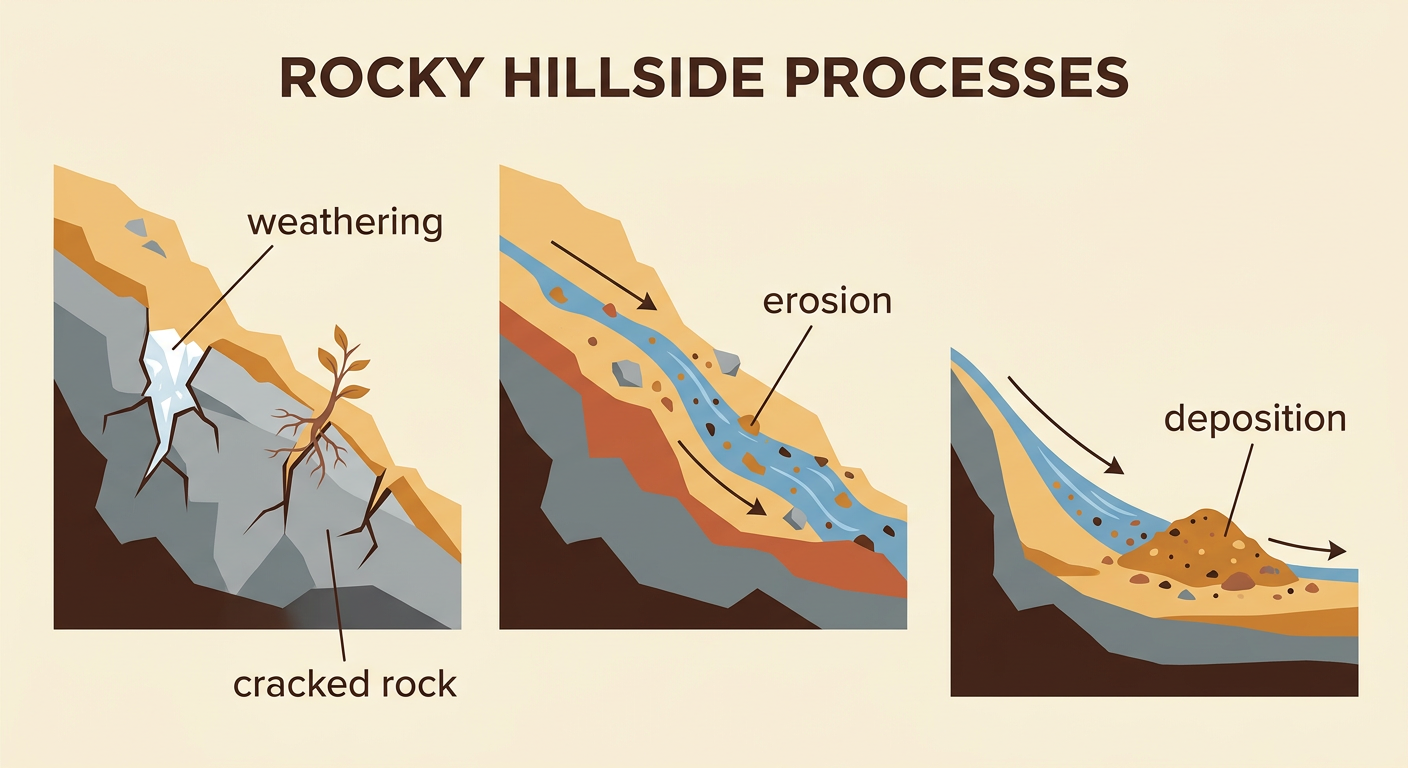
Weathering and erosion both change Earth’s surface, but they are different processes. Weathering breaks rock into smaller pieces without carrying those pieces away. Water can freeze inside a rock crack, expand, and make the crack wider. Plant roots can also grow into cracks and split rock. Erosion happens when water, wind, ice, or gravity moves weathered material to a new place. For example, rain may loosen small particles from a bare hillside. Flowing water can then carry the particles downhill. In this example, breaking and loosening are weathering, while movement is erosion. The material may later be dropped, or deposited, at the bottom of the hill. Look for evidence of breaking, movement, and deposition when deciding which processes changed a landform.
Identify the Effects of Water and Wind
Moving water and wind can erode land, but they often leave different clues. Rainwater flowing over bare soil can cut narrow channels called rills. As more water follows the same path, some channels may grow into deeper gullies. Rivers can wear away their banks and carry sediment downstream. Wind most easily moves dry, loose particles where there are few plants. It may remove fine soil from a field or blow sand across a beach. When wind slows, the sand can collect in dunes. For example, a fence near a sandy shore may trap blowing sand, forming a mound on the downwind side. Plant roots help hold soil in place, so land with thick vegetation usually erodes more slowly than nearby bare land under similar conditions.

Interpret Erosion Measurement Data
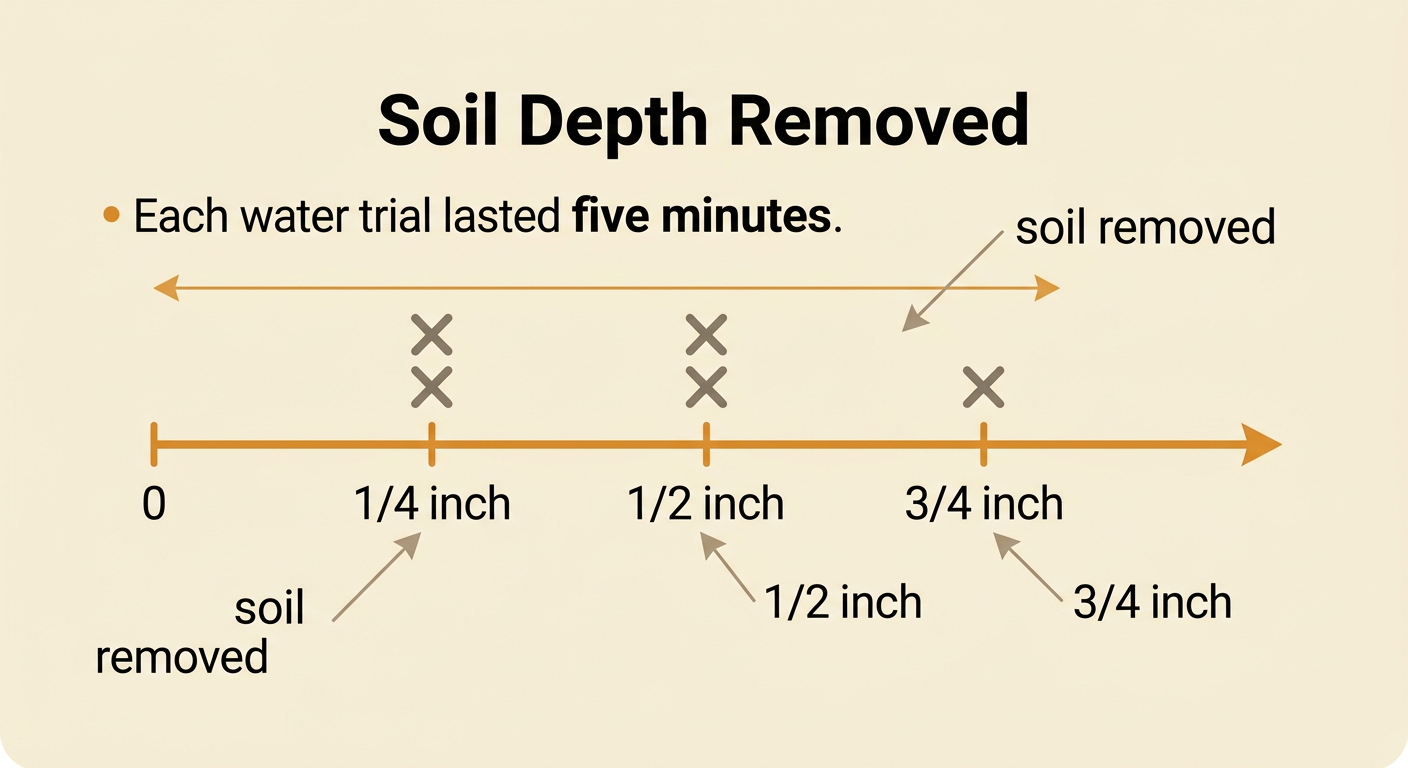
Measurements can show how quickly erosion occurs. Imagine five equal trays of soil receiving the same amount of water for the same length of time. Students measure the depth of soil removed from each tray and record 1/4, 1/2, 1/4, 3/4, and 1/2 inch. On a line plot, place an X above each matching measurement. The plot has two Xs at 1/4 inch, two at 1/2 inch, and one at 3/4 inch. The most common results are 1/4 and 1/2 inch. The range is from 1/4 to 3/4 inch. Because every trial lasted the same amount of time, greater soil loss shows a faster rate of erosion. Measurements support a stronger claim than saying only that “some soil moved.” Scientists also repeat trials because results can vary.
Explain How a Landscape Changed
A strong explanation combines evidence from several sources. Suppose two photographs show that a streambank became steeper and moved closer to a walking path over five years. A map shows that the stream curves sharply at that location. Measurement data show that markers on the outside of the curve lost more soil than markers on the inside. Together, these sources support the claim that flowing water eroded the outside bank and carried sediment away. Some sediment may have been deposited where the water moved more slowly. State the change, identify the process, and cite specific evidence. You could write: “The stream’s outside bank moved toward the path because flowing water eroded it. The photographs show exposed roots, the map shows a river bend, and measurements show greater soil loss on the outside of the bend.”