Human Activities and Global Temperature Change
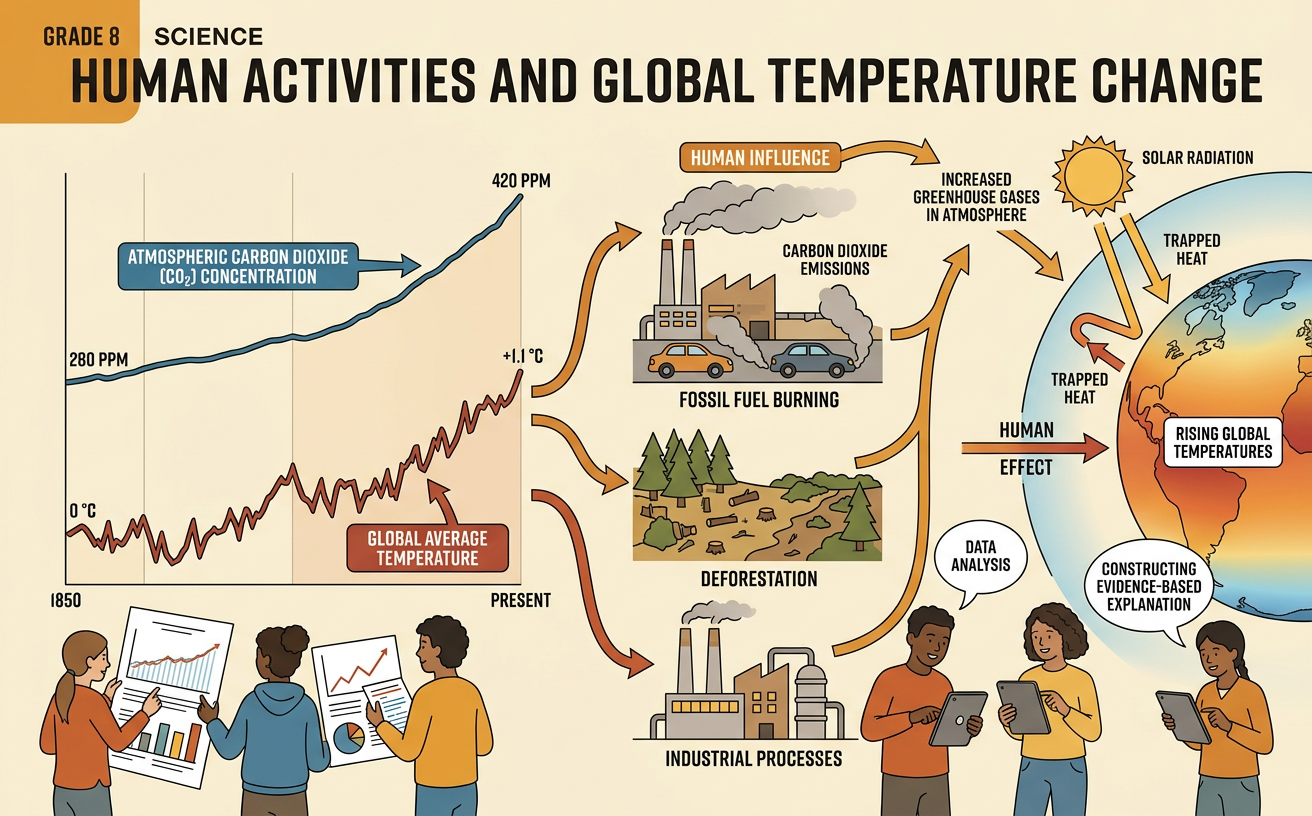
Students analyze atmospheric carbon dioxide and temperature data to construct an evidence-based explanation of how human activities influence global warming.
Illustrations are auto-generated and may be placeholders. They can be refreshed to match the narration.
Reviewing the Greenhouse Effect
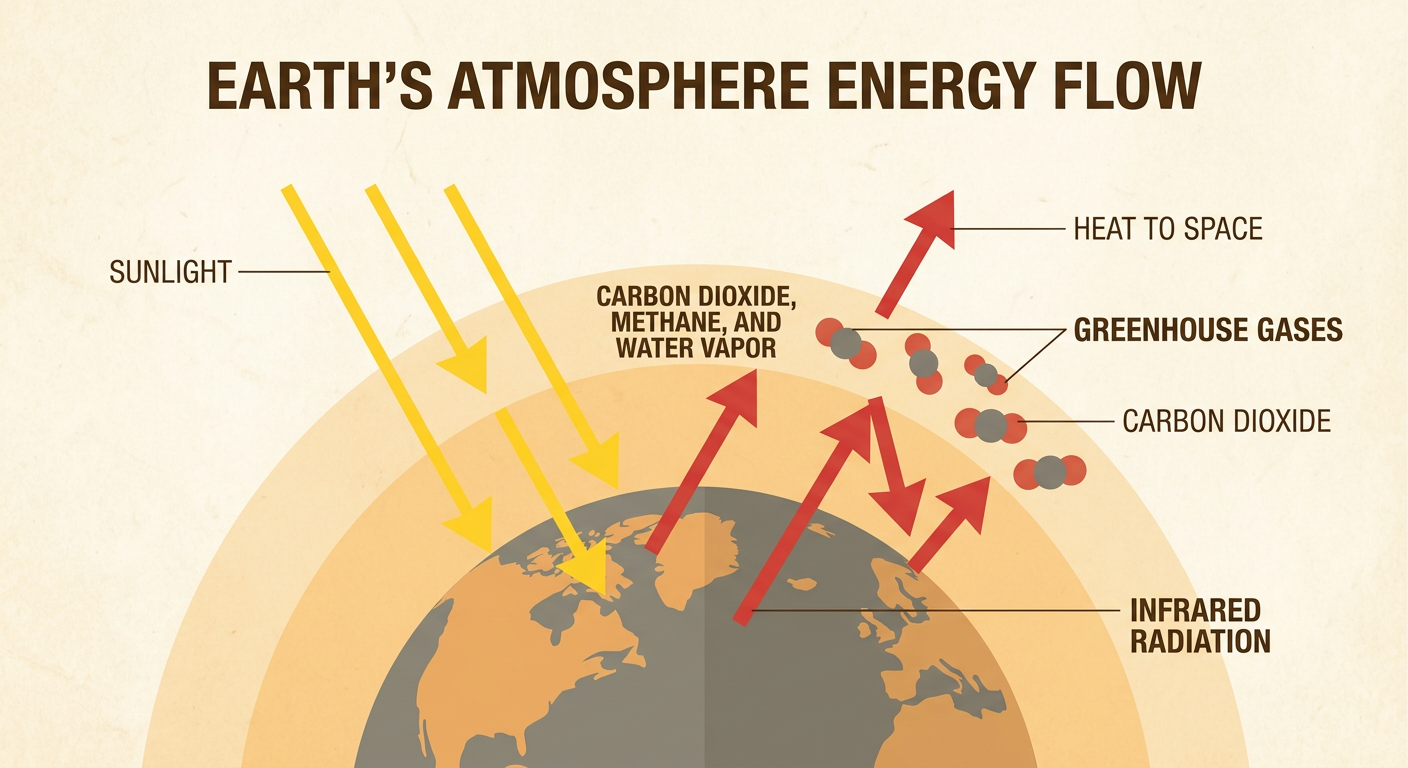
Earth’s surface absorbs energy from sunlight and releases some of that energy as infrared radiation, or heat. Greenhouse gases, including carbon dioxide, methane, and water vapor, absorb and reemit some outgoing infrared radiation. This process keeps Earth warm enough for life. When human activities add more long-lasting greenhouse gases to the atmosphere, less heat escapes to space, changing Earth’s energy balance and raising average temperatures. The gases do not create heat; they slow the movement of heat out of the atmosphere. For example, imagine two identical containers under the same lamp, but one has a greater concentration of carbon dioxide. Under carefully controlled conditions, scientists can measure differences in how the gases absorb infrared radiation. Atmospheric measurements and physics show that increasing carbon dioxide strengthens the greenhouse effect.
Examining Carbon Dioxide Trends
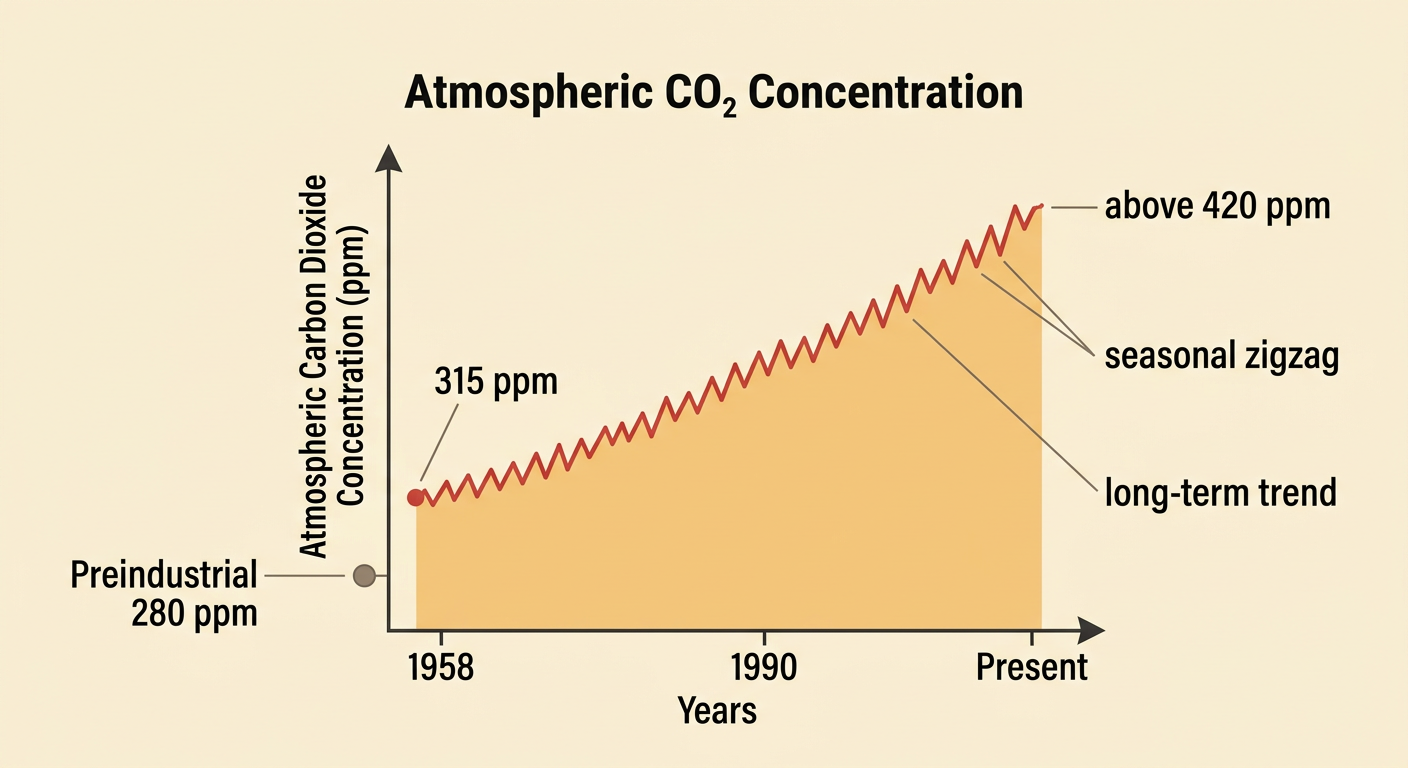
Scientists measure atmospheric carbon dioxide directly at monitoring stations and estimate older concentrations from air bubbles trapped in ice cores. Ice-core evidence shows that carbon dioxide was about 280 parts per million before large-scale industrialization. Measurements at Mauna Loa, Hawaii, began near 315 parts per million in 1958 and have since risen above 420 parts per million. The record has a repeating seasonal zigzag because Northern Hemisphere plants remove more carbon dioxide during spring and summer and release some during fall and winter. However, the long-term direction is clearly upward. For example, a student can compare points from 1960, 1990, and 2020 and calculate the increase between them. This evidence establishes a strong trend, although carbon dioxide data alone do not prove which activities caused the rise or how much warming resulted.
Comparing Temperature Data
Global temperature is calculated from thousands of measurements taken on land and across the oceans. Scientists often report a temperature anomaly, which is the difference between a measured temperature and the average for a chosen reference period. Several independent research groups find the same long-term warming pattern. Earth’s average surface temperature in 2011–2020 was about 1.1 degrees Celsius warmer than in 1850–1900. Individual years can still be cooler or warmer because of events such as volcanic eruptions, El Niño, and La Niña. For example, a cool year during a warming trend does not cancel decades of rising averages, just as one cool afternoon does not end summer. When students place carbon dioxide and temperature records on aligned timelines, both show strong long-term increases, but they should remember that matching trends alone do not establish cause.

Connecting Human Activities to Emissions
Human activities increase atmospheric carbon dioxide mainly by burning coal, oil, and natural gas. Power plants, vehicles, factories, and buildings release carbon that was stored underground for millions of years. Cement production and deforestation also add carbon dioxide. Cutting forests can both release stored carbon and reduce the number of trees available to remove carbon dioxide through photosynthesis. For a concrete example, burning one gallon of gasoline produces about 8.9 kilograms, or 19.6 pounds, of carbon dioxide because carbon in the fuel combines with oxygen from the air. Scientists compare fuel-use records, atmospheric measurements, and the chemical forms of carbon in the atmosphere. These independent sources point to fossil fuels as the main cause of the recent carbon dioxide increase. Oceans and ecosystems absorb part of human emissions, but the remainder accumulates in the atmosphere.

Constructing an Evidence-Based Explanation
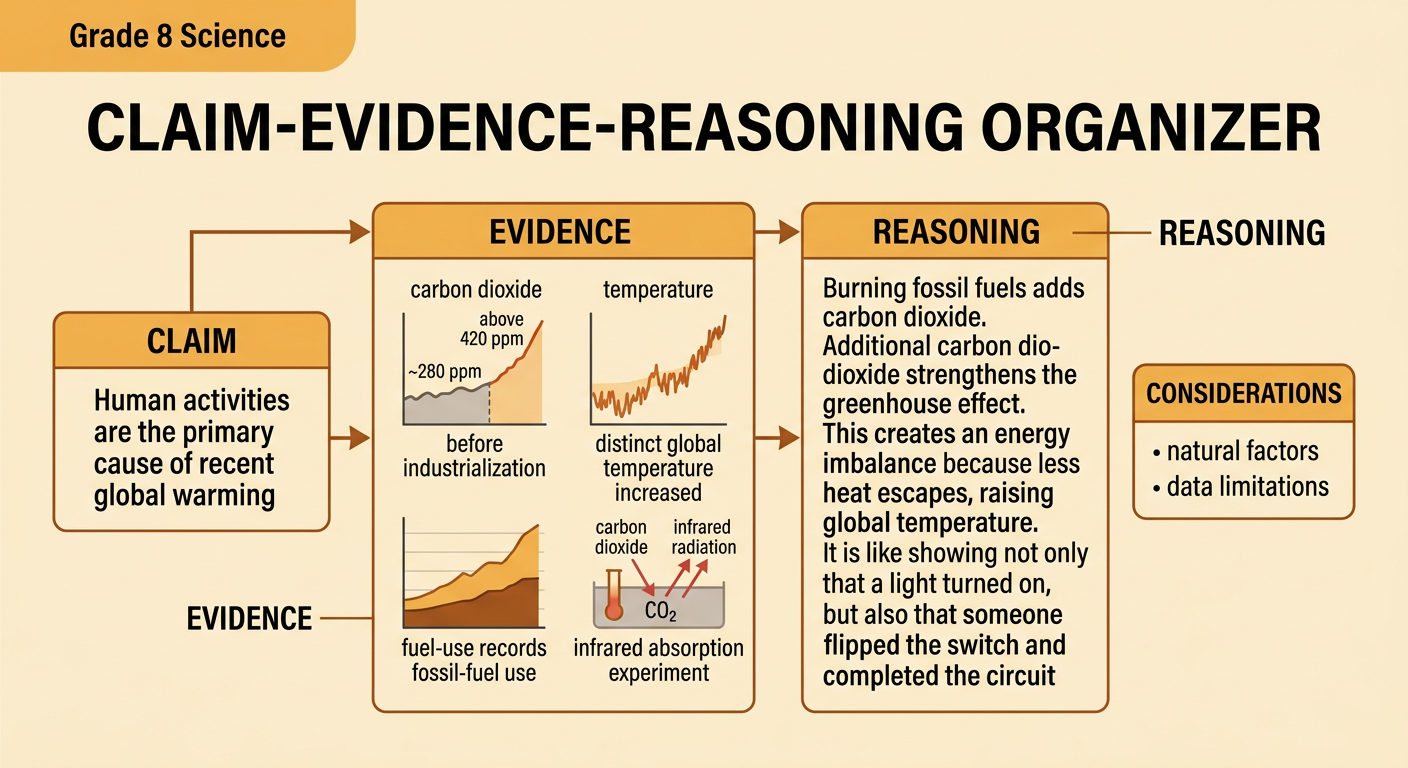
A strong scientific explanation includes a claim, evidence, and reasoning. A useful claim is that human activities are the primary cause of recent global warming. Evidence may include rising carbon dioxide measurements, fossil-fuel use records, laboratory evidence that carbon dioxide absorbs infrared radiation, and global temperature data. Reasoning connects these sources: burning fossil fuels adds carbon dioxide, additional carbon dioxide strengthens the greenhouse effect, and the resulting energy imbalance raises global temperature. Students should cite specific values and sources rather than saying only that a graph “goes up.” They should also discuss limitations. Temperature records have measurement uncertainty, short-term natural changes affect individual years, and correlation by itself does not prove causation. For example, an argument can note that solar changes and volcanoes influence climate but cannot explain the full long-term warming pattern. Considering multiple sources makes the explanation stronger and identifies questions that need further investigation.