
Human Impacts on Watersheds
Students trace how pollutants move through a watershed and propose a practical method for monitoring or reducing their environmental effects.
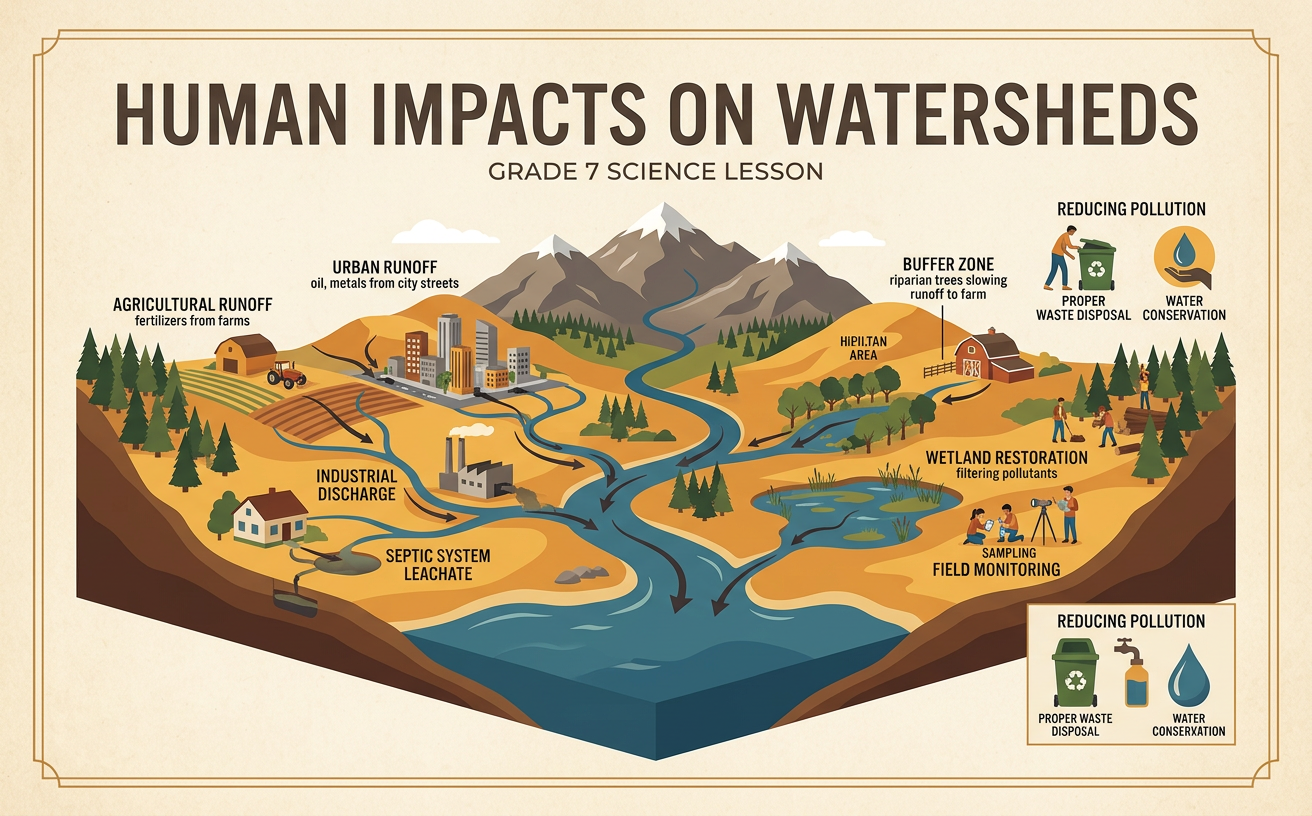
Illustrations are auto-generated and may be placeholders. They can be refreshed to match the narration.
What Is a Watershed?
A watershed is an area of land where water drains to the same outlet, such as a stream, lake, wetland, or ocean bay. High points of land form the watershed boundary. Rain and melting snow flow downhill as runoff, soak into soil, or enter groundwater. Small streams called tributaries join larger streams and rivers. Watersheds can be very small or cover thousands of square miles, and smaller watersheds can be nested inside larger ones. For example, rain falling on a school roof may enter a storm drain, flow into a nearby creek, and eventually reach a major river. In a watershed diagram, tracing the downhill arrows shows how activities far from a river can still affect its water quality.

Tracing Runoff and Pollution
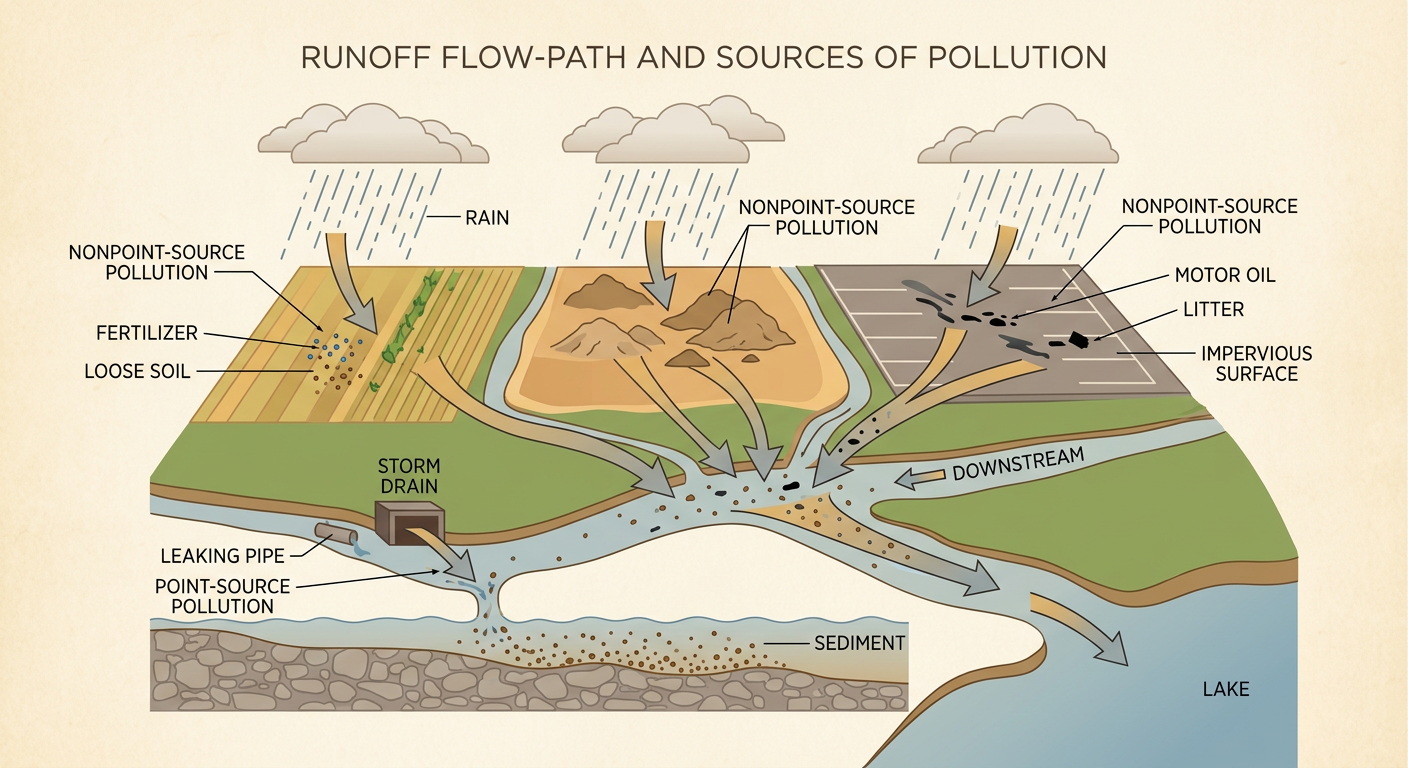
Runoff can carry pollutants across land and into waterways. Point-source pollution comes from one identifiable location, such as a leaking pipe. Nonpoint-source pollution comes from many spread-out sources, such as fertilizers, oil on roads, soil from construction sites, and pet waste. Impervious surfaces like pavement prevent water from soaking into the ground, so runoff moves faster and may carry more pollution. For example, during a storm, rain can wash motor oil and litter from a parking lot into a storm drain. If that drain empties into a creek without treatment, pollutants travel downstream. Some pollutants settle into sediment, while others dissolve in water or enter organisms. Arrows on a watershed map can be used to predict the route and possible destinations of each pollutant.
Effects on Ecosystems and Communities
Pollution can change both ecosystems and human communities. Excess fertilizer adds nitrogen and phosphorus to water, causing rapid algae growth. When algae die, decomposers use dissolved oxygen, leaving less oxygen for fish and other aquatic animals. Sediment can cover fish eggs, block sunlight, and damage habitats. Polluted water may also increase drinking-water treatment costs, limit fishing or swimming, and harm jobs connected to recreation. These effects are not always shared equally. A downstream community may receive pollution produced upstream and have little control over its source. Over time, water shortages or contamination can create conflict over costs and responsibility. They can also encourage cooperation, such as neighboring towns agreeing to protect stream buffers and share water-quality data throughout the watershed.

Evaluating Monitoring Methods
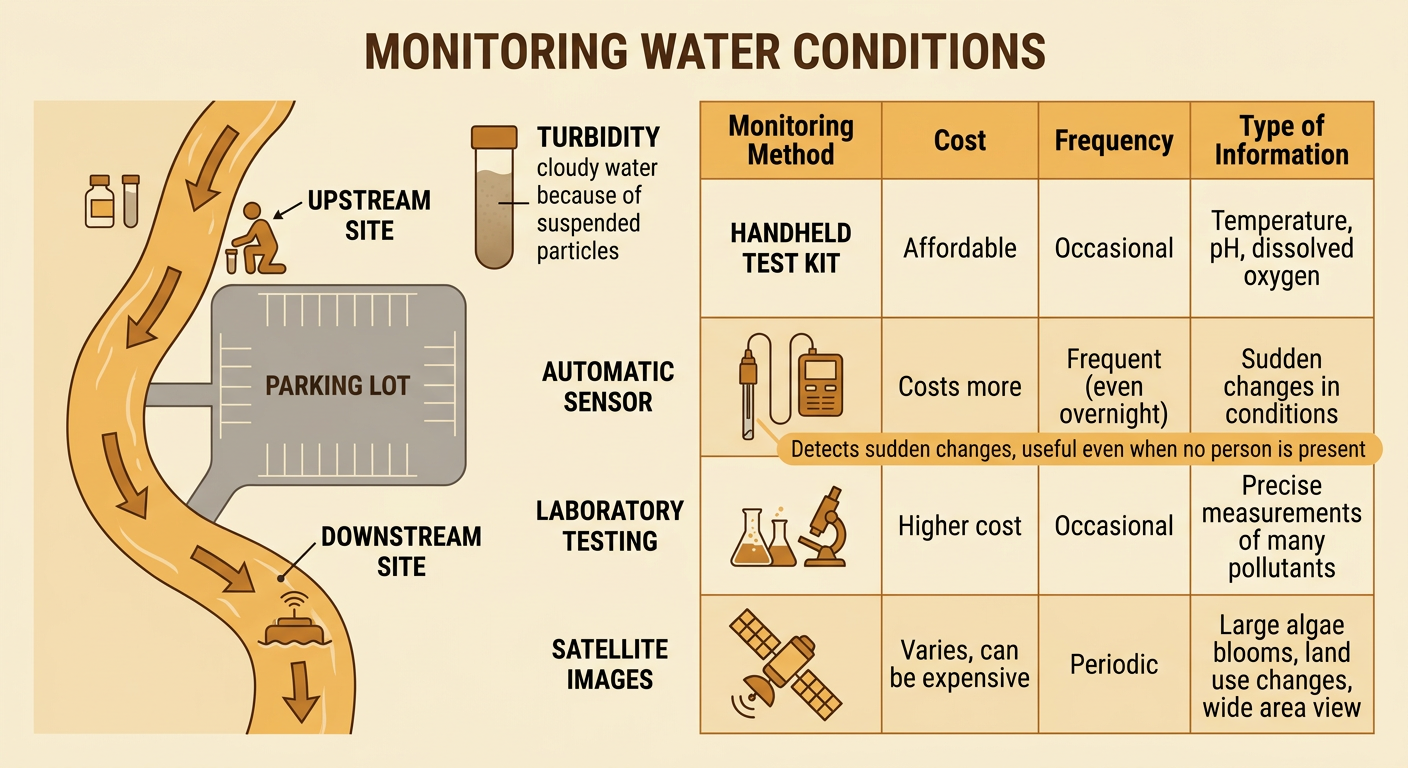
Monitoring provides evidence about where pollution occurs and whether conditions improve. Scientists may test temperature, pH, turbidity, dissolved oxygen, nutrients, or bacteria. Each method has strengths and limits. A handheld test kit is affordable and useful for class investigations, but results may be less precise than laboratory analysis. Automatic sensors collect frequent data and can detect sudden changes, but they cost more and require maintenance. Satellite images can reveal large algae blooms or land-use changes, yet they cannot directly measure every pollutant. A strong plan includes repeated measurements at the same times and locations. For example, students could compare water samples upstream and downstream from a parking lot before and after rain. This design helps separate normal stream conditions from changes connected to runoff.
Designing a Pollution-Reduction Strategy
An effective pollution-reduction strategy should address a known source, fit local conditions, and include a way to measure success. Begin by defining the problem and criteria, such as reducing muddy runoff while staying within a budget. Then compare possible solutions and consider constraints, including space, cost, maintenance, and community needs. For example, a school could build a rain garden beside a parking lot. Native plants and soil would slow runoff, trap sediment, and allow more water to soak into the ground before reaching a storm drain. Students could monitor turbidity at the drain before construction and at regular intervals afterward. They should collect data during similar weather conditions. If turbidity does not decrease, the team could add plants, improve maintenance, or adjust the design. Sharing results with local residents and officials can support broader watershed cooperation.
