
Integrating Information from Text and Visual Media
Students combine relevant details from a written passage and a visual source to develop a clear, coherent understanding of a topic.

Illustrations are auto-generated and may be placeholders. They can be refreshed to match the narration.
Identify Each Source’s Main Focus
Before combining sources, identify what each one is mostly about. Look at the title, headings, repeated ideas, and type of information in each source. Imagine a source set about trees and city temperatures. The written passage, titled “How Trees Cool City Neighborhoods,” explains how shade and water vapor from leaves can reduce heat. Its main focus is the cooling processes provided by trees. The visual source is a bar graph titled “Tree Cover and Afternoon Temperature.” It compares tree cover and temperatures in three neighborhoods. Its main focus is the relationship between the amount of tree cover and measured temperature. The sources share a general topic, but they contribute different information. Stating each focus separately helps you decide which details are relevant when you later connect the sources.

Read the Written Source
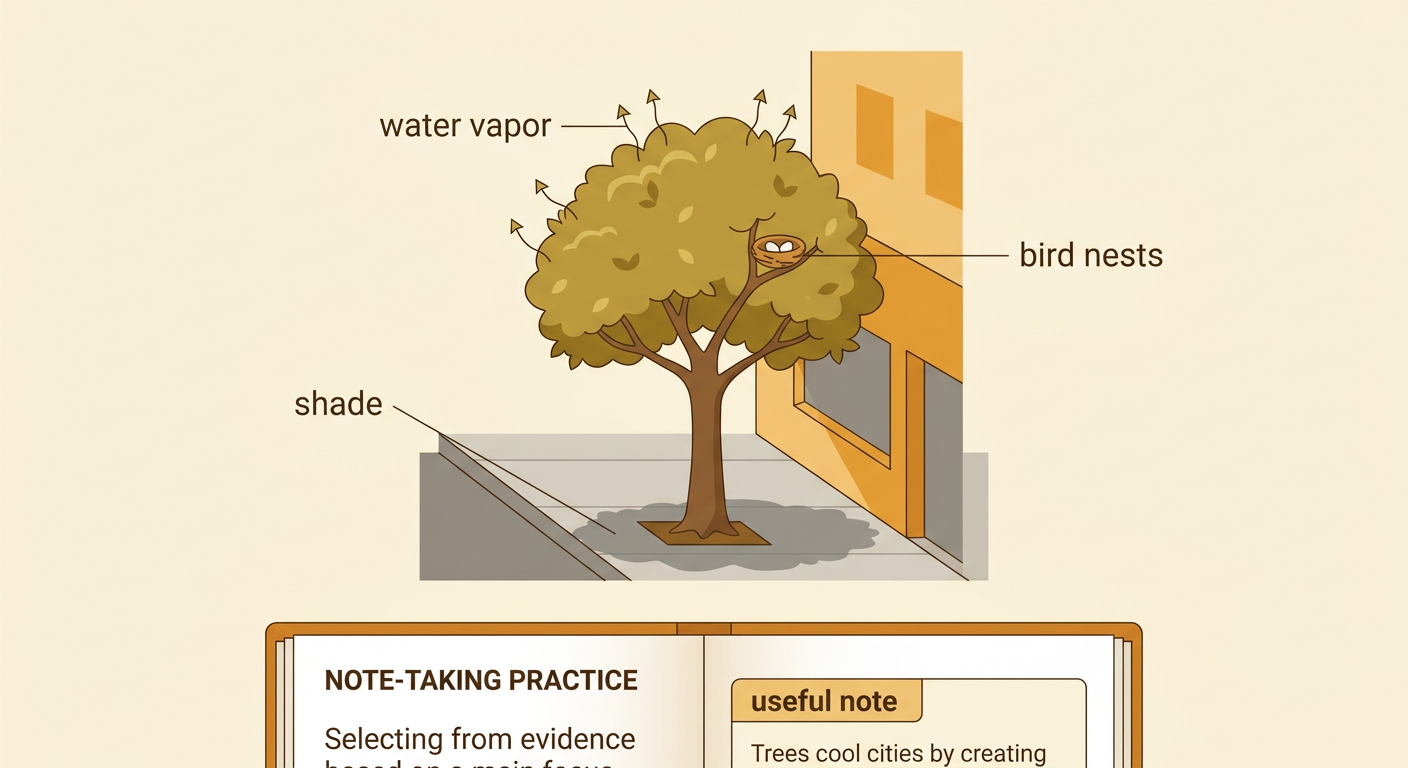
Read the written source closely and select details that support its main focus. Do not copy every fact. Ask which details explain the topic and how they relate to one another. In the passage about city trees, one sentence states that branches and leaves shade sidewalks, roads, and buildings from sunlight. Another explains that trees release water vapor through their leaves, which can help cool the surrounding air. These are relevant details because they describe two ways trees can reduce heat. A sentence about birds building nests in trees may be interesting, but it does not directly explain neighborhood temperature. You can record the useful information in a brief note: Trees cool cities by creating shade and releasing water vapor. This note captures the passage’s key ideas in your own words without adding unsupported claims.
Analyze the Visual Source
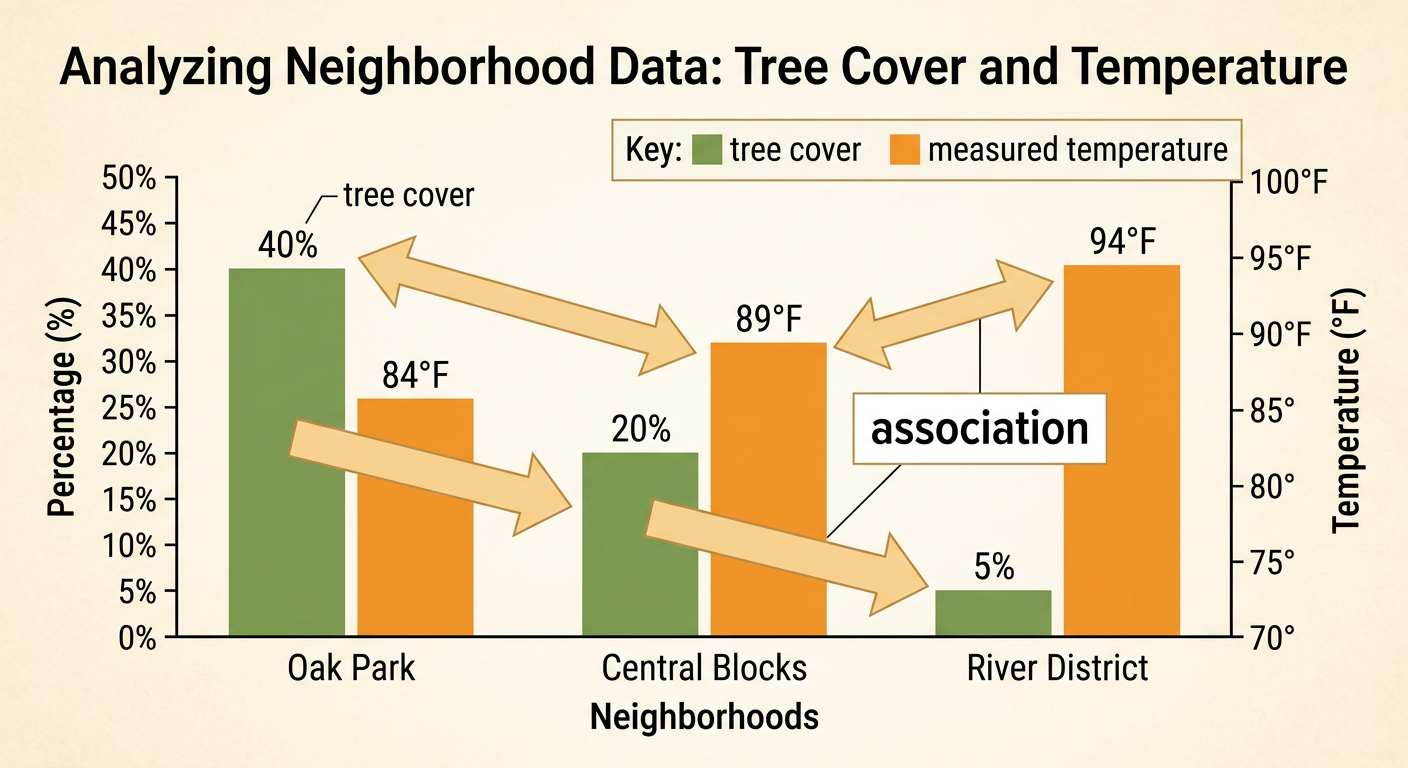
To analyze a visual source, first read its title, labels, scale, and key. Then describe the pattern using specific evidence. In the example bar graph, Oak Park has 40 percent tree cover and an afternoon temperature of 84°F. Central Blocks has 20 percent tree cover and a temperature of 89°F. River District has 5 percent tree cover and a temperature of 94°F. The pattern is that neighborhoods with more tree cover had lower measured temperatures. Use careful language: the graph shows an association, but it does not prove that tree cover caused every temperature difference. Other factors may also affect temperature. A strong observation would be, “Oak Park had 35 percentage points more tree cover and was 10°F cooler than River District.” This statement accurately compares the displayed values.
Connect Ideas Across Sources
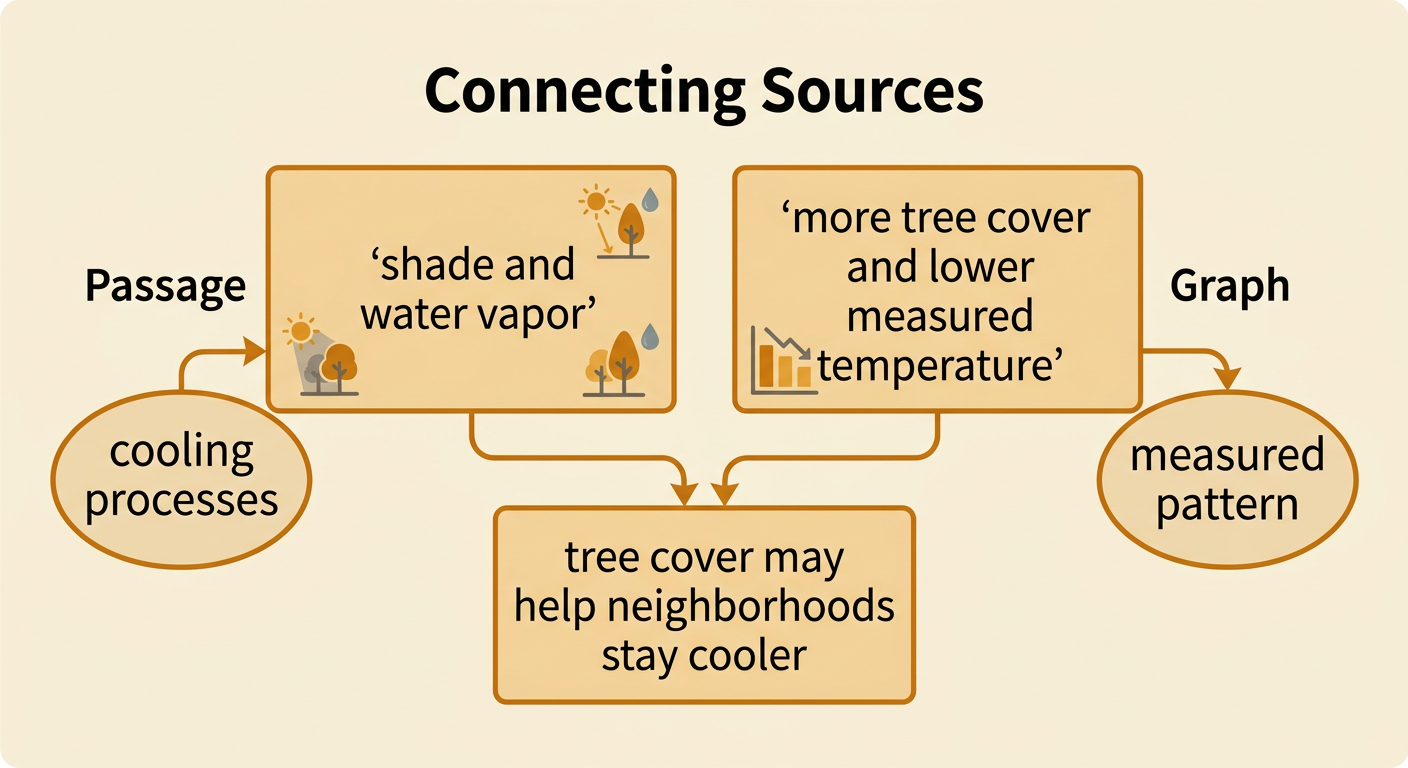
Connecting sources means explaining how information from one source relates to information from another. Look for ideas that agree, add detail, provide an example, or appear to conflict. The passage explains that trees can cool an area by shading surfaces and releasing water vapor. The graph adds measured evidence: the neighborhood with the most tree cover had the lowest afternoon temperature, while the neighborhood with the least tree cover had the highest. Together, the sources support the idea that greater tree cover may help keep neighborhoods cooler. However, do not claim that the graph proves the passage. The passage provides possible cooling processes, while the graph provides a pattern from three locations. A useful connecting sentence is, “The graph supports the passage’s explanation because areas with more tree cover were cooler in the displayed measurements.”
Write a Coherent Explanation
A coherent explanation presents connected ideas in a logical order. Begin with a clear claim about the shared topic. Next, include relevant evidence from both sources and explain how the details fit together. Use transitions such as “according to the passage,” “the graph shows,” and “together.” For example: “Tree cover may help reduce heat in city neighborhoods. According to the passage, trees shade pavement and release water vapor, two processes that can cool nearby areas. The graph shows that Oak Park, with 40 percent tree cover, measured 84°F, while River District, with only 5 percent tree cover, measured 94°F. Together, these sources suggest that neighborhoods with more trees may experience lower afternoon temperatures.” This explanation is coherent because it states a claim, accurately uses both sources, connects the evidence, and avoids claiming more than the sources prove.
