
Interpreting Functions and Their Key Features
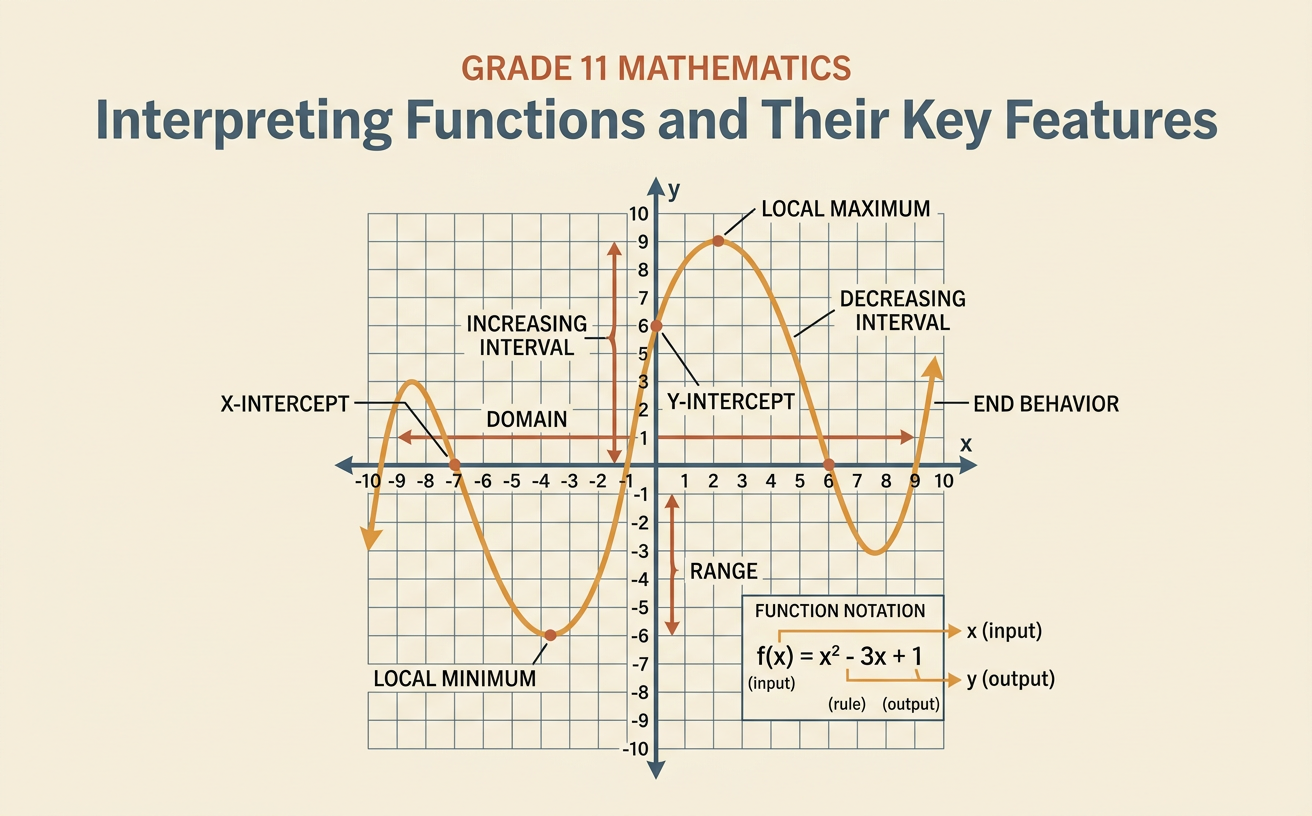
Students interpret function notation and identify domain, range, intercepts, intervals, extrema, and end behavior from graphs and contextual descriptions.
Illustrations are auto-generated and may be placeholders. They can be refreshed to match the narration.
Function Notation Review
Function notation describes how an output depends on an input. In f(x), the letter f names the function, x represents the input, and f(x) represents the output. The notation f(x) does not mean f multiplied by x. To evaluate a function, substitute the given input into its rule. For example, if f(x) = 3x − 5, then f(4) = 3(4) − 5 = 7. This means that the input 4 is paired with the output 7, so the point (4, 7) lies on the graph. An equation such as f(a) = 10 states that the function’s output is 10 when the input is a. Function notation can represent formulas, tables, graphs, or real-world relationships.
Domain and Range
The domain of a function is the set of all allowable input values, while the range is the set of all resulting output values. On a graph, find the domain by looking from left to right and the range by looking from bottom to top. Consider g(x) = √(x − 1) + 2. Because the expression under a square root cannot be negative for real-valued functions, x − 1 must be at least 0. Therefore, the domain is [1, ∞). The graph begins at (1, 2) and rises, so its smallest output is 2 and its range is [2, ∞). In a real-world model, the domain may be further restricted by context, such as requiring time or distance to be nonnegative.
Intercepts and Intervals
Intercepts show where a graph meets the coordinate axes. An x-intercept occurs where the output is 0, and a y-intercept occurs where the input is 0. For f(x) = x² − 4, solving x² − 4 = 0 gives x = −2 and x = 2, so the x-intercepts are (−2, 0) and (2, 0). Evaluating f(0) gives −4, so the y-intercept is (0, −4). The graph decreases on (−∞, 0) and increases on (0, ∞). It is above the x-axis, or positive, on (−∞, −2) and (2, ∞). It is below the x-axis, or negative, on (−2, 2). Interval notation communicates where each behavior occurs.
Extrema and End Behavior
Extrema are high or low points of a function. A local maximum is greater than nearby outputs, while a local minimum is less than nearby outputs. Absolute extrema are the greatest or least outputs over the entire domain. For f(x) = x³ − 3x, the graph has a local maximum at (−1, 2) and a local minimum at (1, −2), but it has no absolute maximum or minimum because it continues without bound. End behavior describes what happens to outputs as inputs become very large in either direction. For this function, as x approaches positive infinity, f(x) approaches positive infinity. As x approaches negative infinity, f(x) approaches negative infinity. Graph arrows help show this long-term behavior.
Contextual Interpretation
When a function models a real situation, each feature must be interpreted using the quantities and units in the problem. Suppose V(t) represents the volume of water, in gallons, in a tank t minutes after observation begins. The graph starts at V(0) = 200, rises linearly to 500 gallons at t = 6, remains at 500 gallons until t = 10, and then falls to 100 gallons at t = 18. The domain is [0, 18] minutes, and the range is [100, 500] gallons. The maximum volume is 500 gallons during the interval [6, 10]. From 0 to 6 minutes, the average rate of change is 50 gallons per minute. From 10 to 18 minutes, it is −50 gallons per minute, indicating that water is leaving the tank.