Investigating Questions with the Scientific Method
Students plan a controlled investigation by developing a testable question and hypothesis, identifying variables, analyzing sample data, and using evidence to revise conclusions.
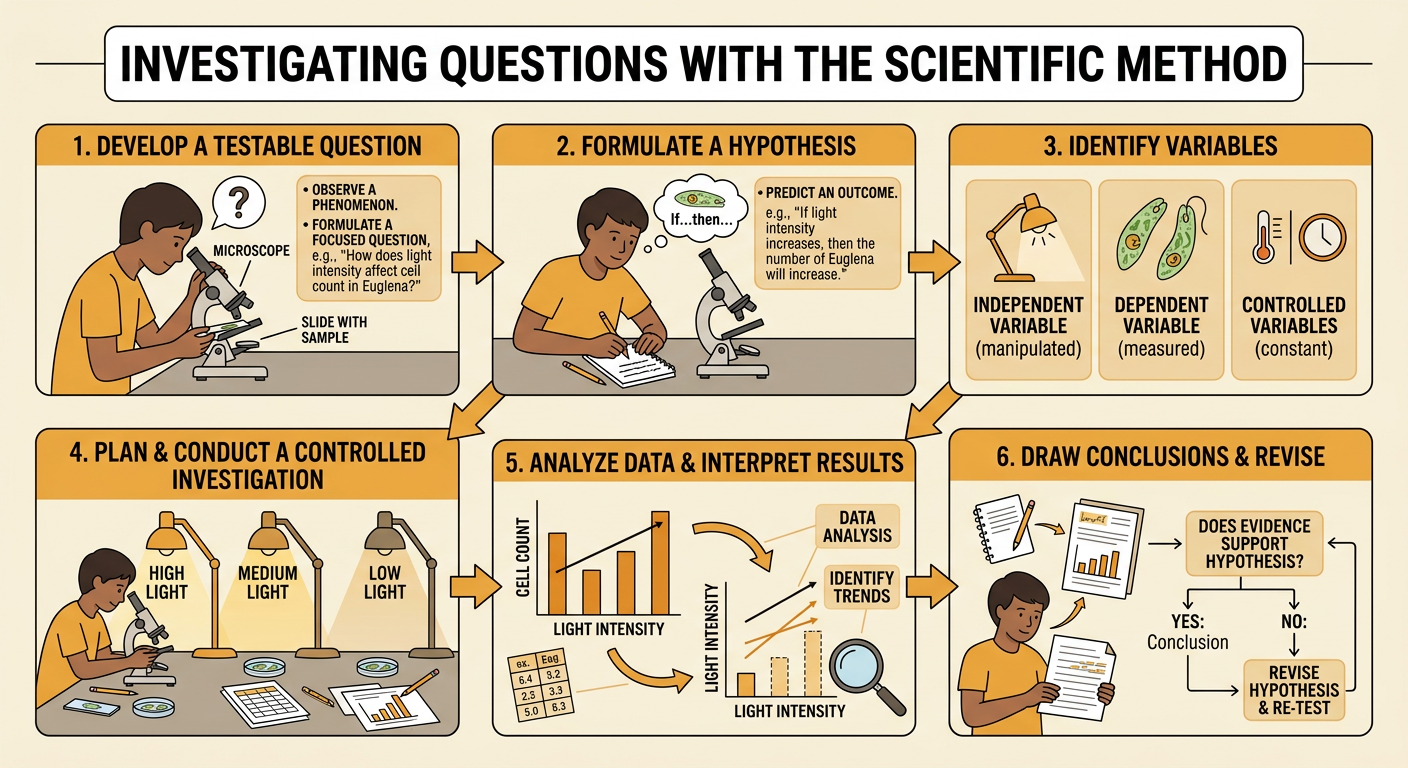
Illustrations are auto-generated and may be placeholders. They can be refreshed to match the narration.
Scientific Inquiry as an Iterative Process
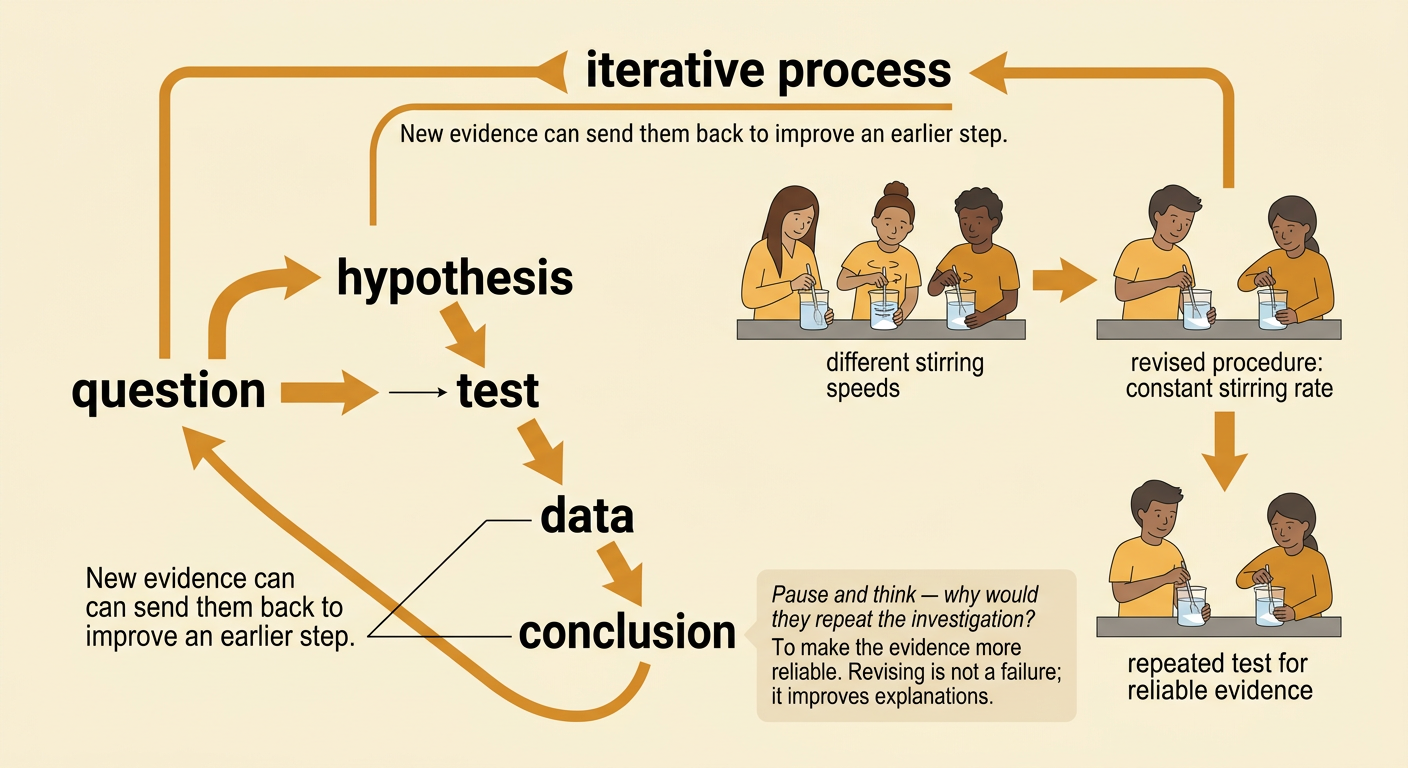
Scientific inquiry is an organized way to investigate questions using observations and evidence. It is iterative, which means scientists often repeat or revise steps instead of following a straight path once. They ask a question, form a hypothesis, plan and conduct a test, analyze data, and draw a conclusion. New evidence may lead them to change the procedure, improve the hypothesis, or ask a new question. For example, students might investigate whether warmer water makes sugar dissolve faster. If their first results vary widely, they may notice that different students stirred at different speeds. They can revise the procedure by using the same stirring rate and then repeat the investigation. Revising a method is not a failure. It strengthens the investigation by making the evidence more reliable and the explanation more accurate.
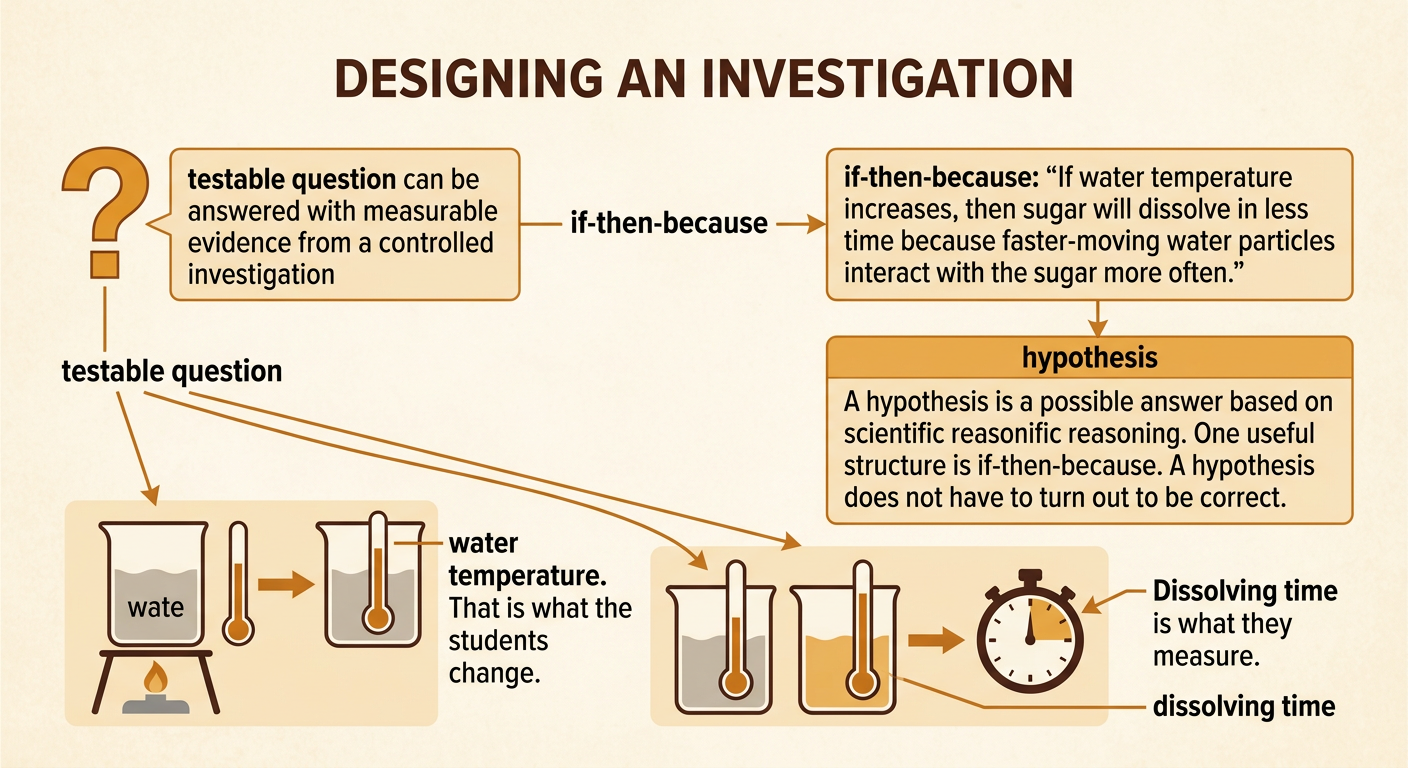
Testable Questions and Hypotheses
A testable question can be answered by collecting measurable evidence in a controlled investigation. It should identify what will be changed and what will be measured. A question such as “Is warm water better?” is too vague because “better” is not measurable. A stronger question is, “How does water temperature affect the time needed for 10 grams of sugar to dissolve?” A hypothesis is a possible answer supported by scientific reasoning. It is often written in an if-then-because form. For example: “If water temperature increases, then the sugar will dissolve in less time because faster-moving water particles collide with and separate sugar particles more frequently.” A hypothesis does not have to be correct. Its purpose is to make a clear prediction that evidence can support, fail to support, or lead students to revise.
Independent, Dependent, and Controlled Variables
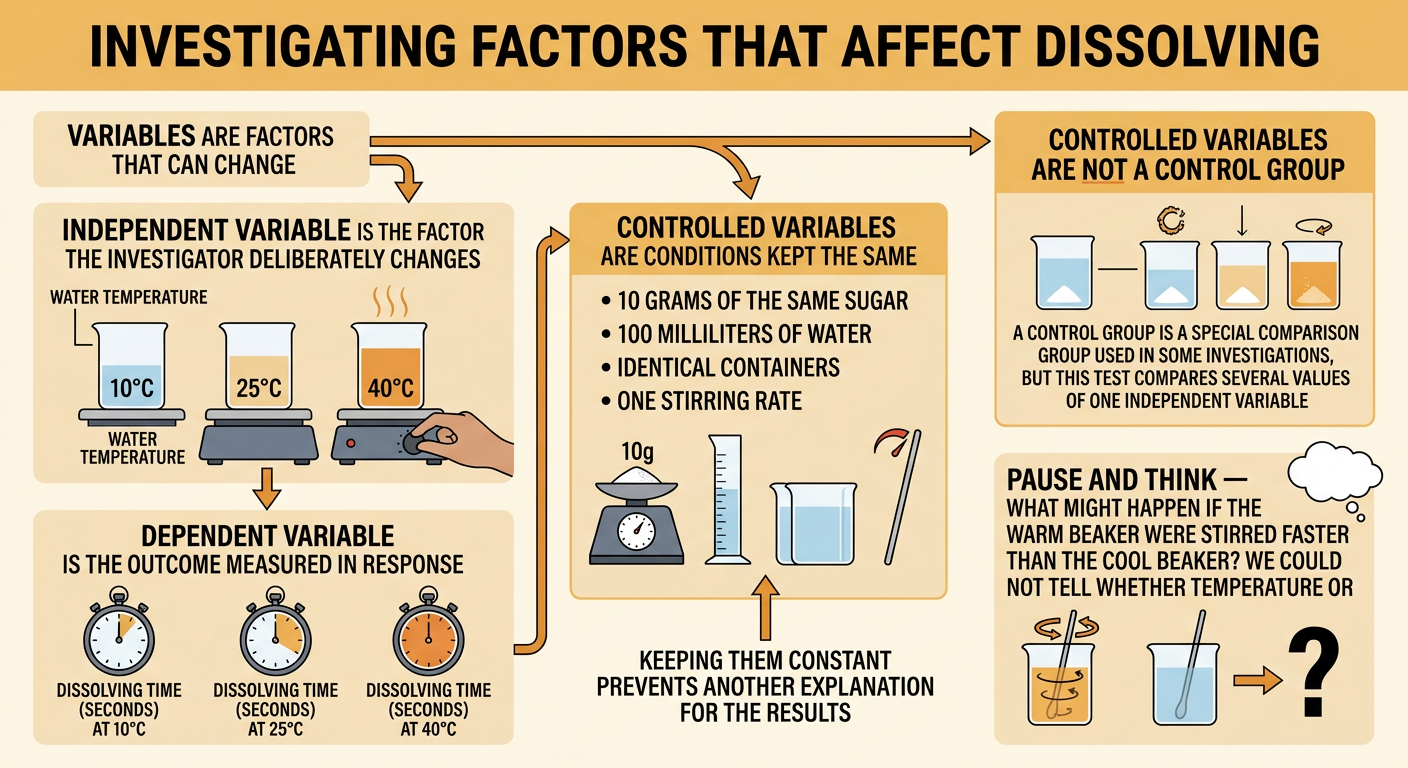
Variables are factors that can change during an investigation. The independent variable is the factor deliberately changed by the investigator. In the sugar investigation, it is water temperature, tested at 10°C, 25°C, and 40°C. The dependent variable is the outcome measured in response. Here, it is the dissolving time in seconds. Controlled variables are factors kept the same so they do not create another explanation for the results. These include the mass and type of sugar, volume of water, container size, stirring rate, and method used to decide when the sugar has dissolved. Controlled variables are not the same as a control group. Some investigations need a comparison group, but this investigation compares several values of one independent variable. Changing only one planned factor helps students determine whether that factor is related to the measured outcome.
Planning a Fair and Repeatable Test
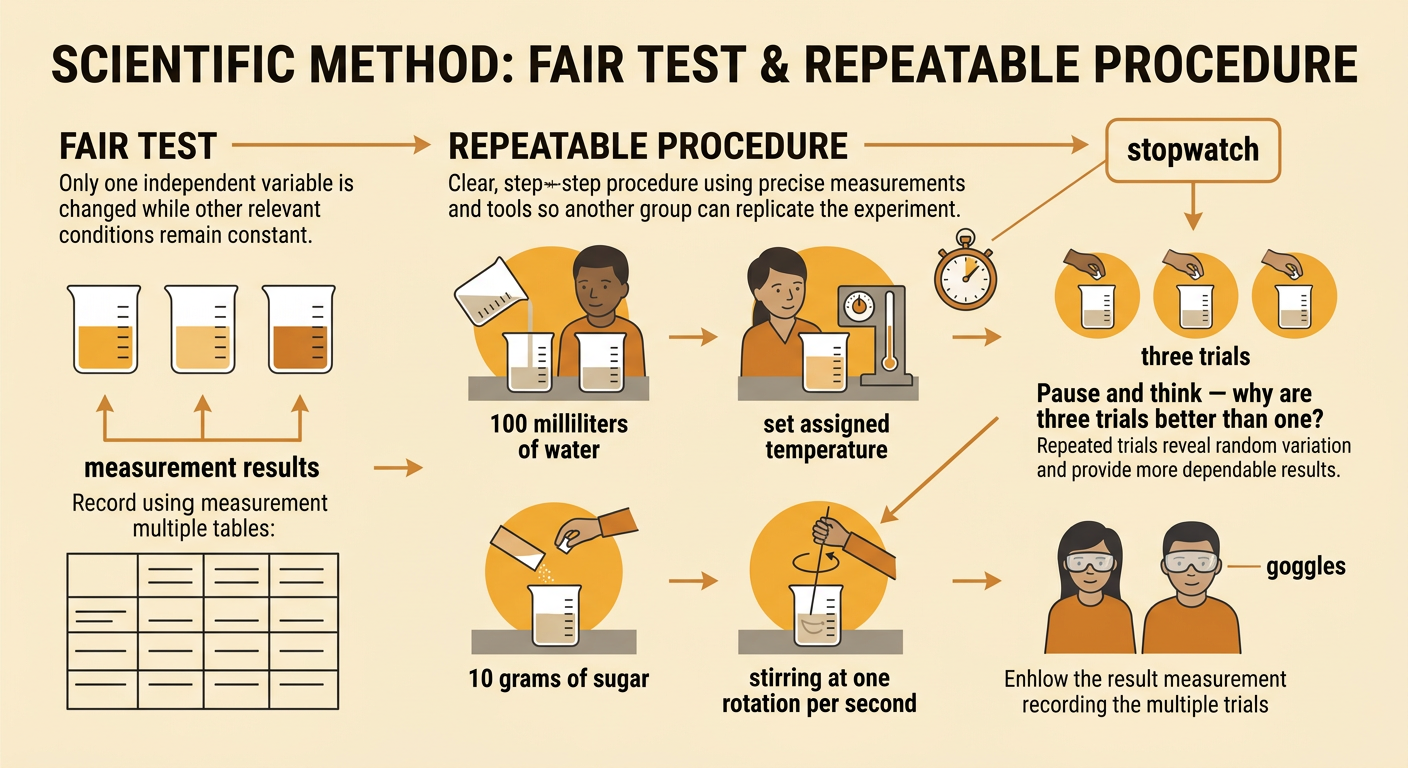
A fair test changes only the independent variable while keeping relevant conditions constant. A repeatable procedure gives exact quantities, units, tools, and steps so another group can carry it out in the same way. For the sugar investigation, students could measure 100 milliliters of water into identical beakers, adjust each sample to the assigned temperature, add 10 grams of sugar, and stir at one rotation per second. They would start a stopwatch when the sugar enters the water and stop it when no visible crystals remain. Conducting at least three trials at each temperature helps reveal random variation. Students should record every result, not only the results they expect. The plan should also identify safety practices, such as wearing goggles and keeping water temperatures below unsafe levels. Following the steps in the same order improves consistency and makes comparisons meaningful.
Analyzing Data for Patterns
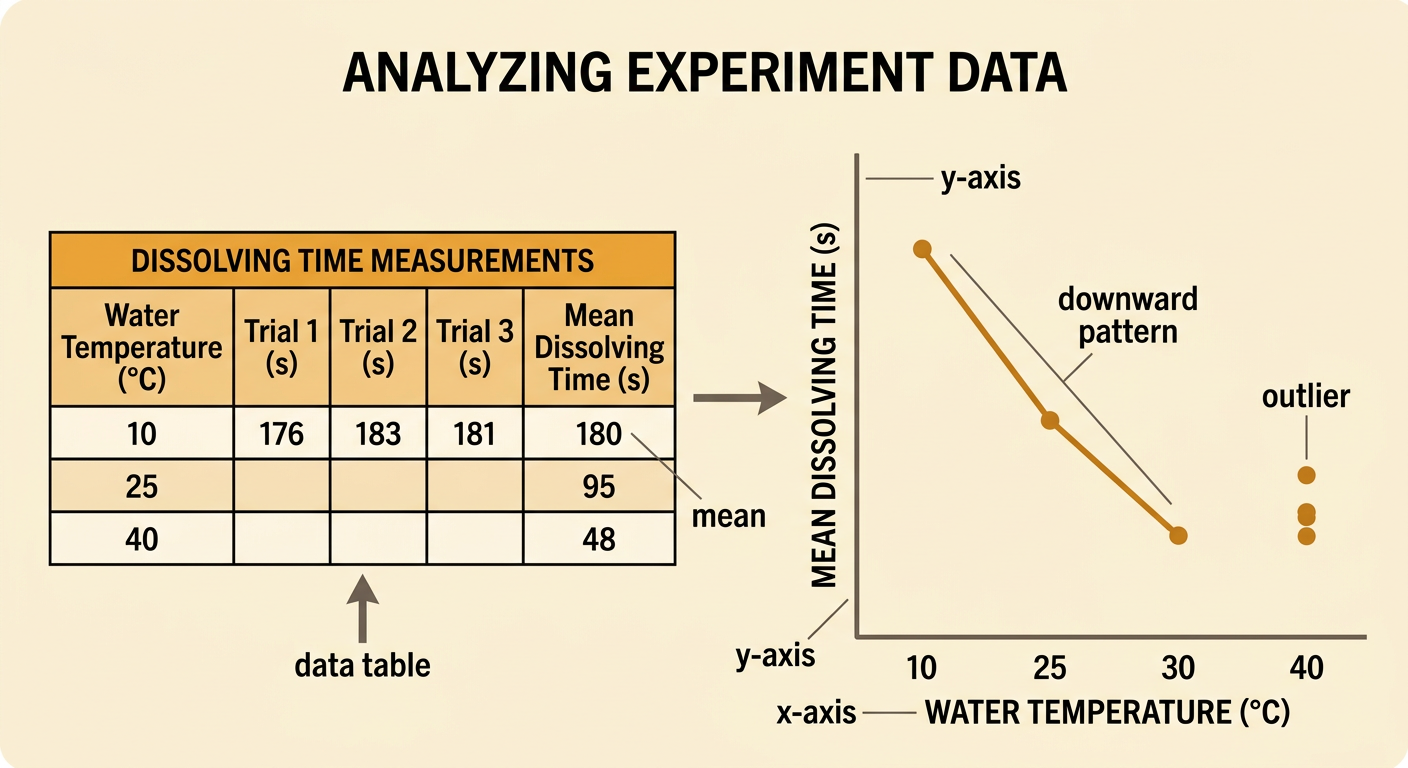
Analyzing data means organizing measurements and looking for patterns, differences, and unusual results. Suppose three dissolving-time trials at 10°C are 176, 183, and 181 seconds, giving a mean of 180 seconds. At 25°C, the times are 92, 98, and 95 seconds, with a mean of 95 seconds. At 40°C, they are 47, 51, and 46 seconds, with a mean of 48 seconds. A data table shows exact values, while a graph makes the overall pattern easier to see. Water temperature belongs on the horizontal x-axis because it is the independent variable. Mean dissolving time belongs on the vertical y-axis because it is the dependent variable. The downward pattern indicates that dissolving time decreased as temperature increased. Students should also examine the spread of repeated measurements and check possible outliers before deciding what the data mean.
Evidence-Based Conclusions and Revisions
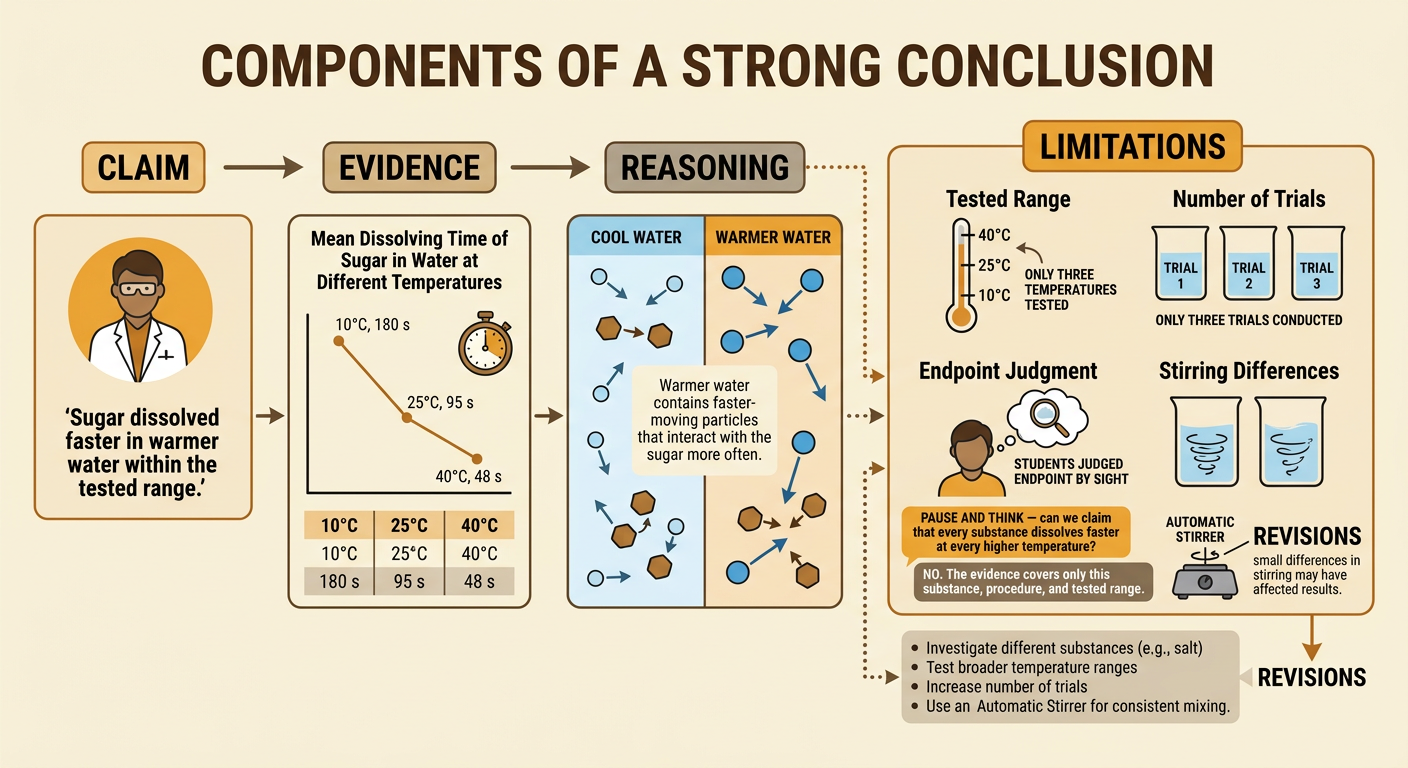
A strong conclusion includes a claim, specific evidence, and reasoning that connects the evidence to the claim. For this investigation, the claim could be that sugar dissolved faster in warmer water within the tested temperature range. The evidence is that mean dissolving time decreased from 180 seconds at 10°C to 95 seconds at 25°C and 48 seconds at 40°C. This pattern supports the hypothesis because warmer water has faster-moving particles that interact with the sugar more often. However, the evidence has limitations. Only three temperatures and three trials were tested, the endpoint was judged visually, and small differences in stirring may have affected the results. Therefore, students should not claim that the pattern applies to every temperature or substance. They could revise the procedure by using an automatic stirrer, testing more temperatures, and conducting more trials. Conclusions become stronger when claims acknowledge both evidence and its limits.