
Keeping Heat In: Comparing Thermal Insulators
Students use temperature evidence to explain thermal energy transfer and evaluate which material best slows heat loss from a container.
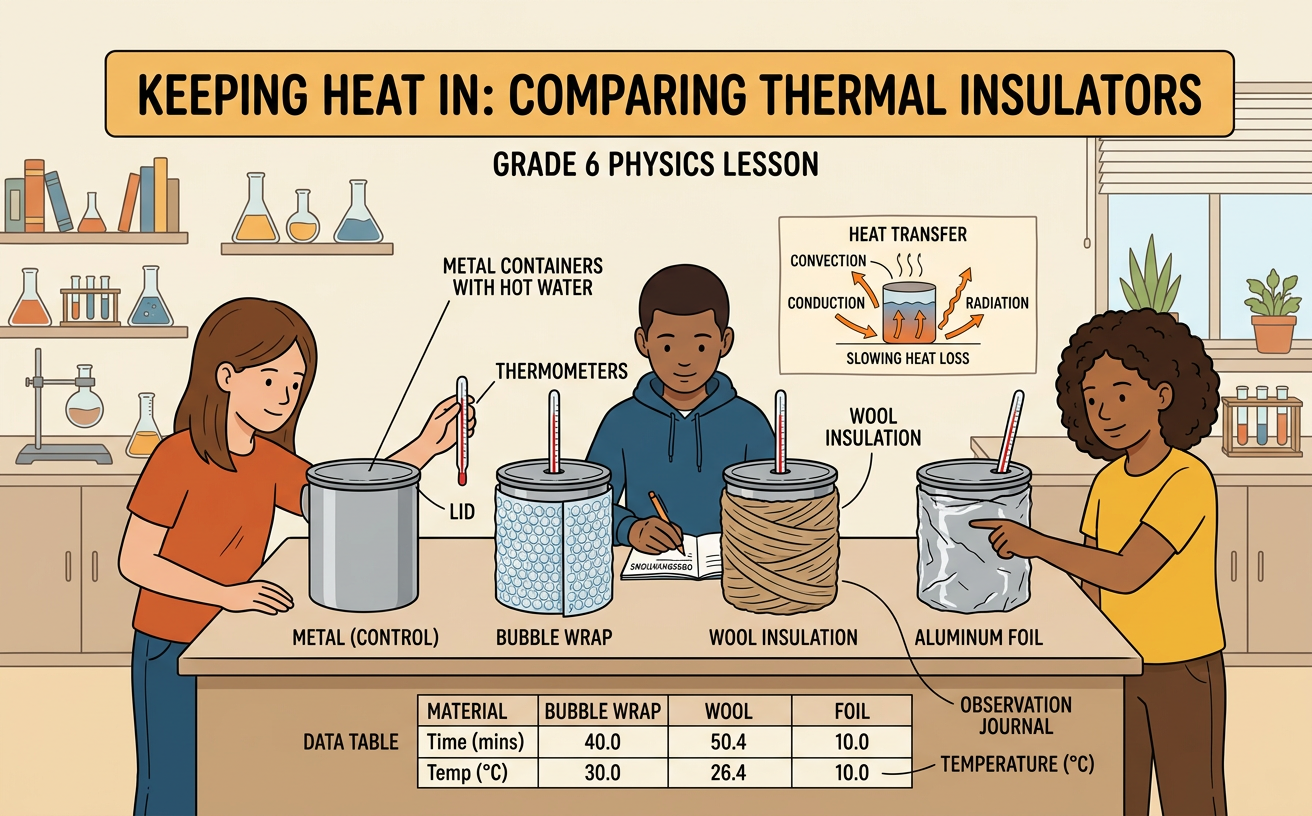
Illustrations are auto-generated and may be placeholders. They can be refreshed to match the narration.
Thermal Energy and Temperature
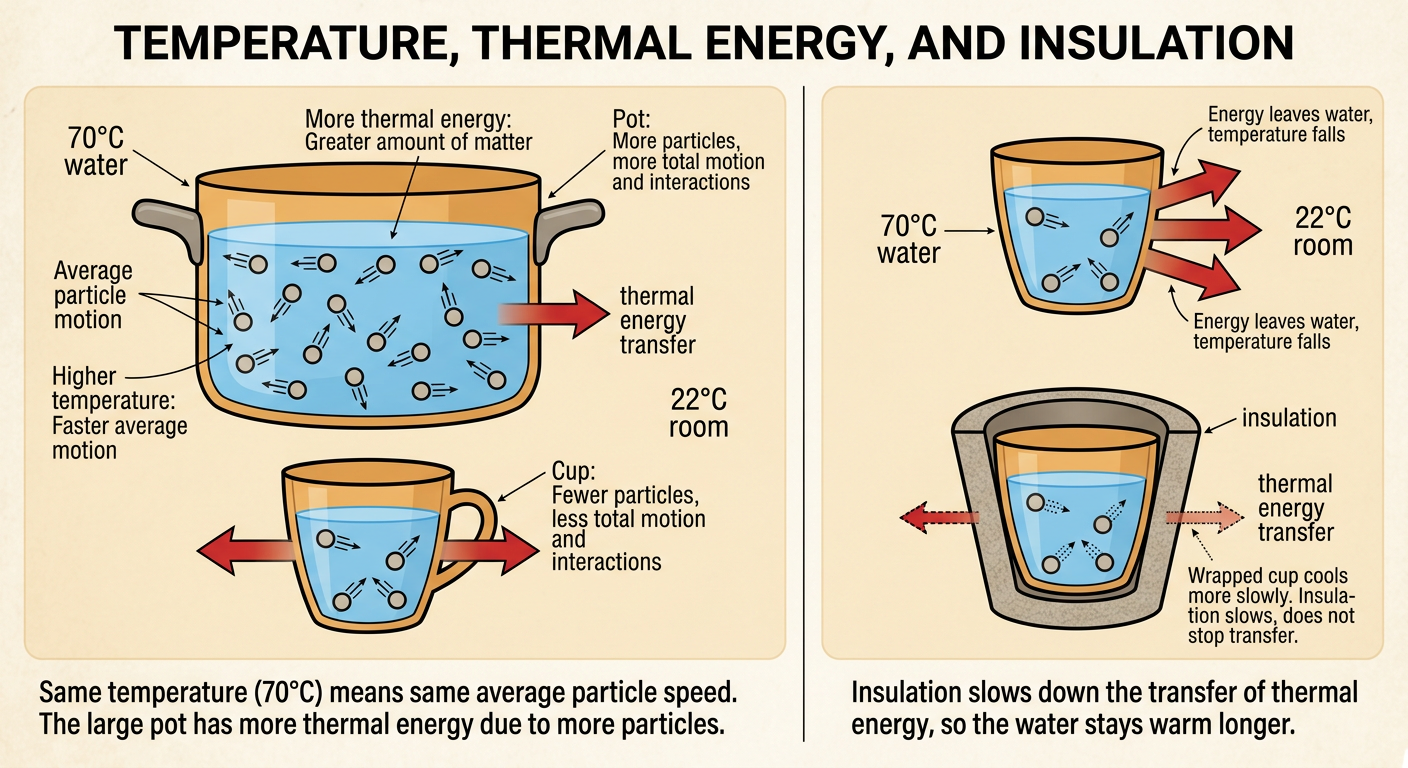
Temperature tells how hot or cold a substance is by showing the average motion of its particles. Thermal energy is the total energy connected to particle motion and interactions in a substance. It depends on temperature, amount of matter, and the kind of material. A large pot and a small cup of water can have the same temperature, but the pot contains more thermal energy because it has more water. When a cup of water at 70°C sits in a 22°C room, thermal energy moves from the warmer water toward the cooler surroundings. As energy leaves, the water’s temperature decreases. An insulator does not stop this transfer completely. Instead, it slows the transfer, helping the water remain warmer for a longer time.
How Heat Moves
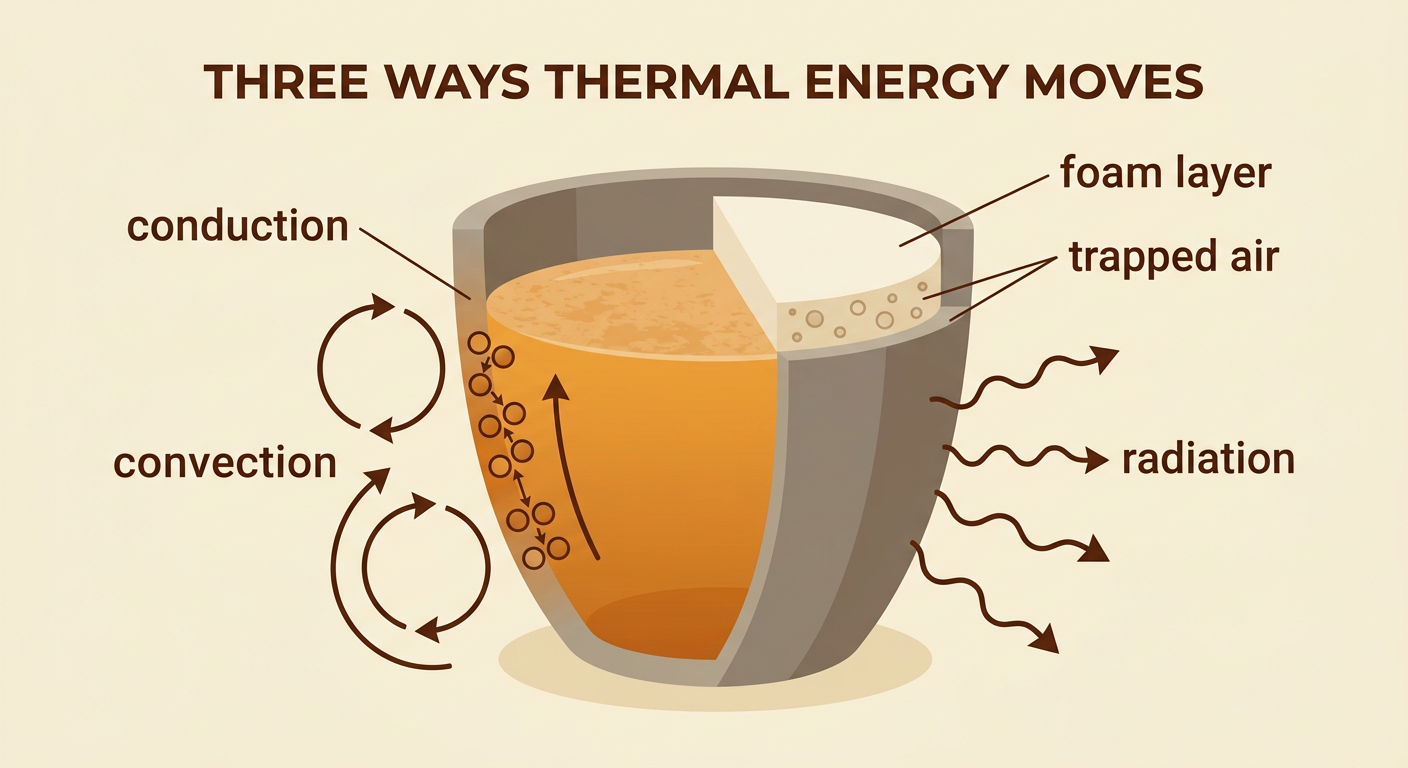
Thermal energy can move by conduction, convection, and radiation. Conduction occurs when neighboring particles transfer energy through direct contact. For example, energy conducts through the wall of a warm metal cup and into the cooler air. Convection occurs when liquids or gases move. Air warmed near the cup rises while cooler air moves in to replace it, creating a circulating current. Radiation transfers energy through electromagnetic waves and does not require direct contact or matter. A warm cup radiates infrared energy toward its surroundings. Insulating materials slow heat loss mainly by reducing conduction and limiting air movement. Foam, for example, traps many small pockets of air. Because the air cannot circulate freely and conducts energy slowly, the foam helps the cup stay warm.
Testing Insulating Materials
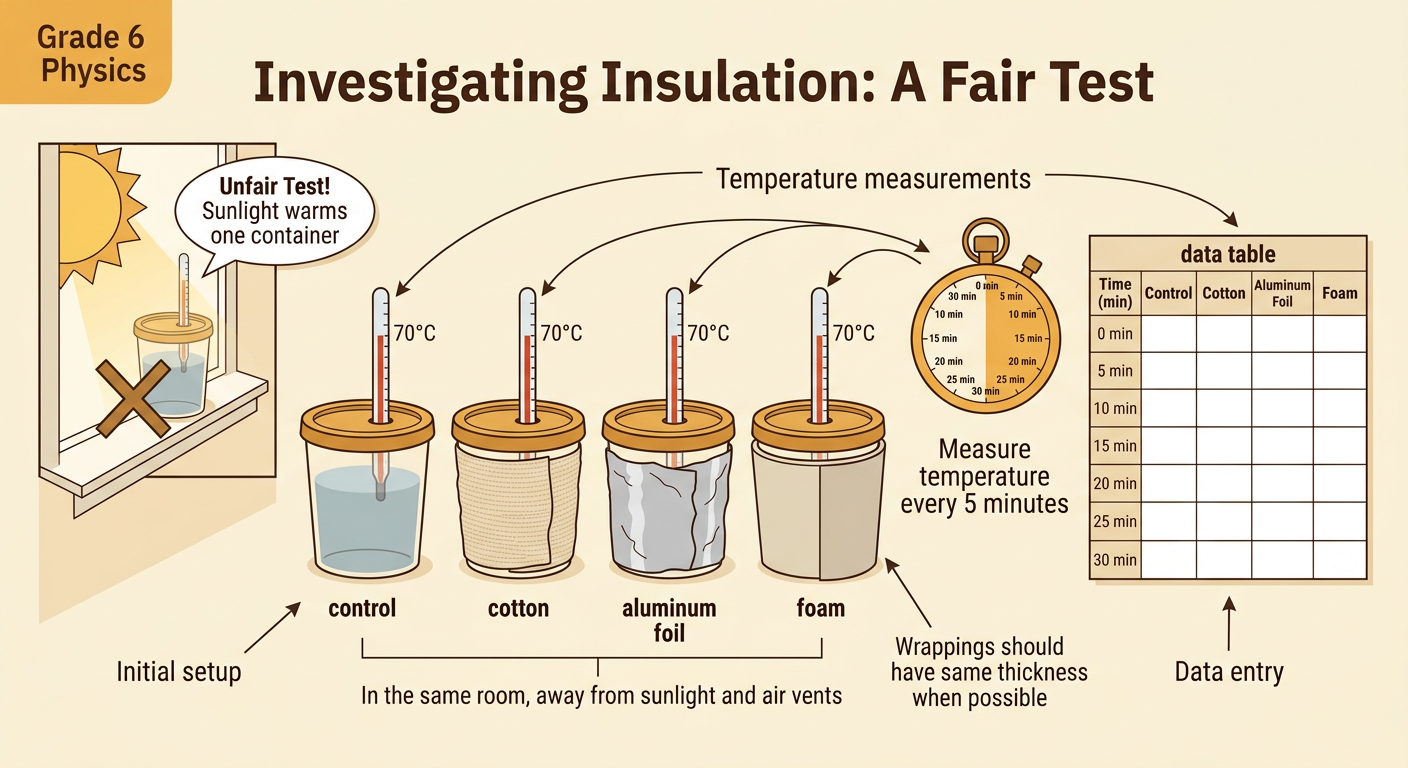
A fair test changes only the insulating material while keeping other conditions the same. Place equal amounts of water at the same starting temperature into identical containers. Wrap one container in cotton, one in aluminum foil, and one in foam. Leave another container unwrapped as a control. Use the same thickness of each wrapping when possible, and place all containers in the same room away from sunlight and vents. Measure the water temperature at equal time intervals, such as every five minutes for 30 minutes. Record each measurement in a data table. For example, if every container begins at 70°C, differences in the final temperatures provide evidence about how well each material slows thermal energy transfer. Repeat the test to check whether the results are consistent.
Comparing Temperature Changes
Temperature data can be compared using total change and rate of change. Suppose all samples begin at 70°C. After 30 minutes, water in the foam-covered container is 61°C, while water in the unwrapped container is 49°C. The foam sample lost 9°C, and the control lost 21°C. Its average cooling rate was 9°C divided by 30 minutes, or 0.3°C per minute. The control cooled at 0.7°C per minute. A smaller temperature decrease and a slower cooling rate show better insulation. If the room is 20°C, each sample began 50°C above room temperature. The foam lost 9 out of those 50 degrees, or 18 percent of its starting difference above room temperature. A line graph makes the evidence easy to see: the line that slopes downward least represents the material that best slows heat loss.

Choosing the Best Insulator
The best insulator is chosen by using evidence and considering both benefits and costs. If foam keeps water warmest, it performs best in the temperature test. However, a design decision may also consider price, availability, durability, safety, mass, and environmental impact. For example, foam might reduce the temperature by only 9°C but cost $2 per container. Cotton might allow a 12°C decrease but cost only $0.75 and be reusable. Aluminum foil may be light and inexpensive, yet a thin layer may not trap enough air to insulate well. Students can create a decision table, assign each factor a score, and explain which factors matter most for the intended use. A strong recommendation cites numerical temperature evidence, identifies trade-offs, and explains why the selected material offers the best balance rather than simply naming the warmest final container.
