Lead in Public Water: Evidence, Equity, and Government Accountability
Students analyze civic documents and water-quality data to determine how governments should respond to lead contamination while considering public health, equity, cost, and accountability.
Illustrations are auto-generated and may be placeholders. They can be refreshed to match the narration.
The Right to Safe Public Services
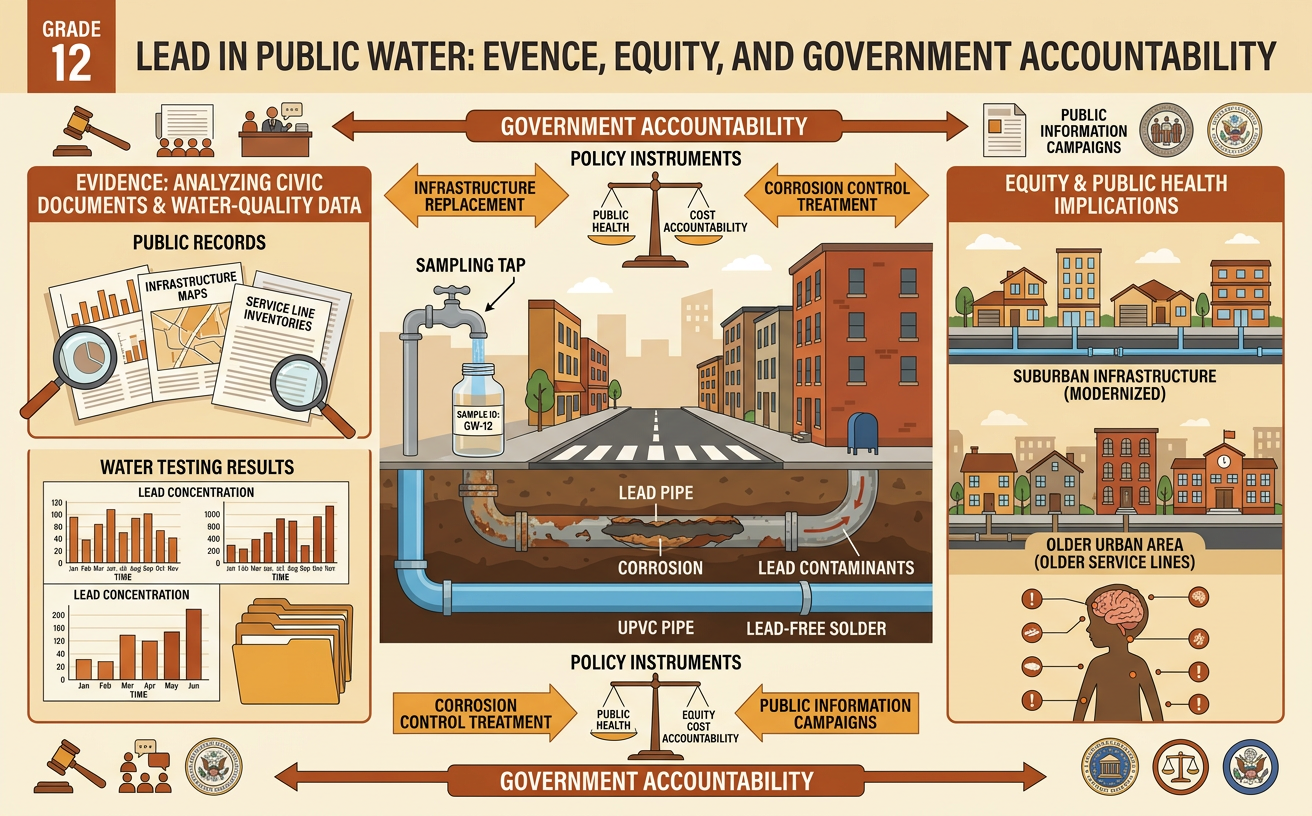
Safe drinking water is a basic public need, but the U.S. Constitution does not explicitly guarantee a federal right to water. Instead, laws such as the Safe Drinking Water Act require public water systems and government regulators to protect water quality. Equity matters because exposure and government response may differ across neighborhoods. For example, a city may replace lead service lines quickly in a wealthy area while requiring lower-income residents to pay part of the replacement cost. Students should ask who receives protection, who bears costs, and who has meaningful access to information. Citizens can request records, speak at public meetings, contact elected officials, organize community testing, and challenge unequal policies. Public institutions remain accountable when decisions are transparent, evidence-based, lawful, and open to citizen participation.

Reading a Water-Quality Data Set
Water-quality evidence becomes useful when students organize, graph, and interpret it carefully. Suppose eight household samples contain 5, 7, 9, 12, 14, 18, 24, and 31 parts per billion of lead. The median is 13 parts per billion, and three of eight samples, or 37.5 percent, exceed 15 parts per billion. A dot plot shows the distribution, while a scatterplot can compare lead concentration with factors such as building age. Students should identify clusters, outliers, and possible associations without claiming that correlation proves causation. The federal Lead and Copper Rule uses system-level sampling calculations, including a 90th-percentile value, so 15 parts per billion should not be treated as a guarantee that an individual tap is safe. Sampling method, timing, and location also affect the results.

Tracing Government Responsibility
Responsibility for public water safety is divided among several institutions. A local water utility treats water, monitors the system, maintains infrastructure, and informs customers. A state environmental or health agency usually enforces drinking-water requirements and reviews monitoring reports. The Environmental Protection Agency sets and oversees national standards under federal law. Mayors, councils, legislatures, and governors approve budgets, conduct oversight, and may order corrective action. Courts can review legal claims, while journalists and community organizations can investigate and publicize failures. For example, if a utility detects elevated lead levels but delays notification, students should examine the utility’s reports, state enforcement records, meeting minutes, and public statements. Accountability requires tracing who knew about the danger, when they knew it, what legal authority they had, and whether they acted promptly and honestly.

Evaluating Policy Options and Trade-Offs
A strong policy evaluation compares alternatives using prioritized criteria and real constraints. Relevant criteria include health protection, speed, equity, long-term effectiveness, cost, and public trust. Constraints may include limited funding, construction capacity, legal authority, and the number of affected homes. Certified point-of-use filters can reduce exposure quickly when installed, maintained, and used correctly, but they are a temporary measure. Corrosion-control treatment can reduce lead release throughout a system, yet it requires expert monitoring and does not remove lead pipes. Full lead service line replacement offers a durable solution but costs more and may take years. For example, students might recommend free filters and bottled water immediately, optimized corrosion control within months, and neighborhood-prioritized pipe replacement over several years. A decision matrix makes trade-offs visible rather than allowing cost alone to determine the response.

Writing an Evidence-Based Civic Recommendation
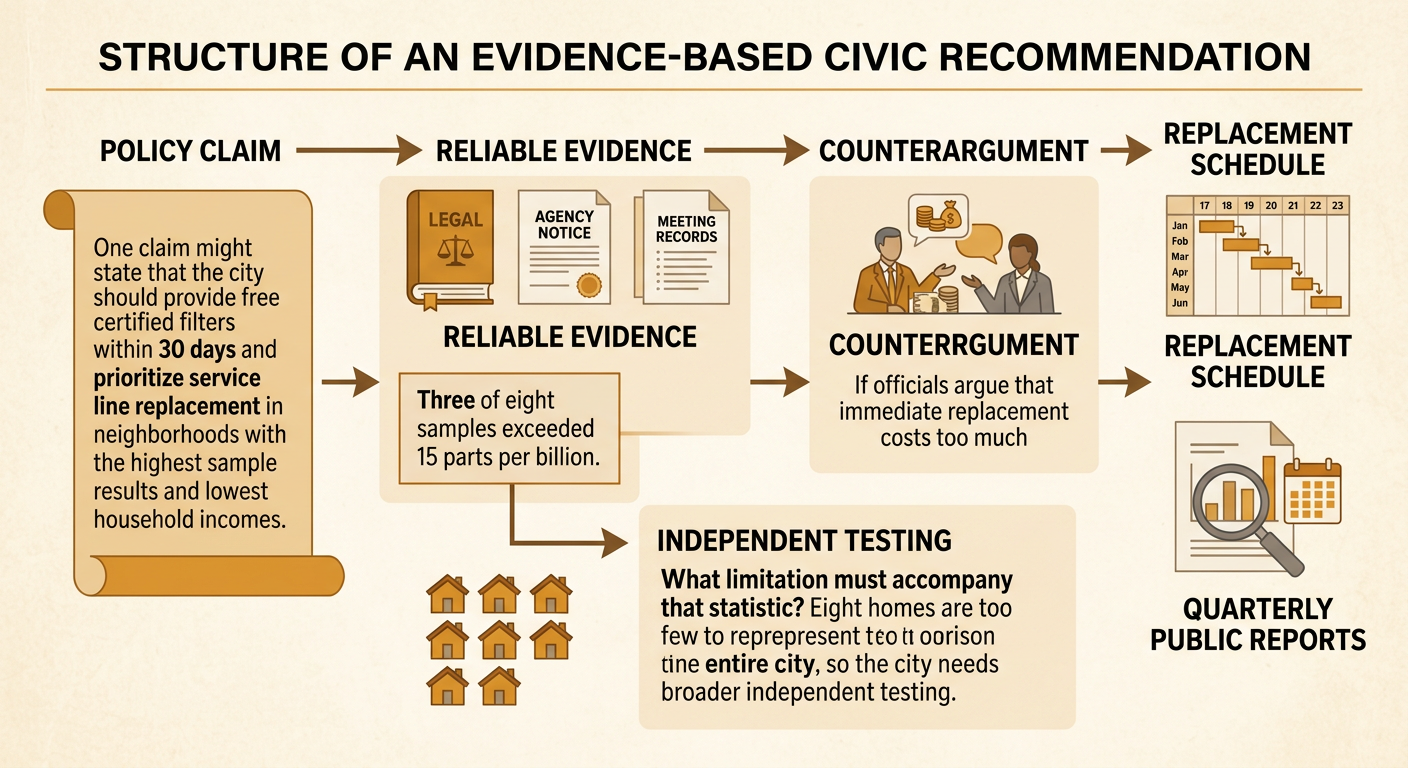
An evidence-based civic recommendation states a clear policy claim, supports it with reliable evidence, addresses trade-offs, and assigns responsibility. Begin by identifying the problem and the people most affected. Cite specific language from laws, agency notices, meeting records, or expert reports, and use numerical evidence from the water-quality data. For example, a student might argue that the city should provide free certified filters within 30 days and prioritize service line replacement in neighborhoods with the highest sample results and lowest household incomes. The recommendation could cite the finding that three of eight samples exceeded 15 parts per billion while acknowledging that eight homes are too few to represent the entire city. It should also identify funding constraints, answer a counterargument about cost, and propose measurable oversight, such as quarterly public reports, independent testing, and a published replacement schedule.