
Mapping Earthquake Risk: Patterns, Forecasts, and Preparedness
Students analyze earthquake location and magnitude data to identify spatial patterns, distinguish forecasting from exact prediction, and explain how evidence can guide community preparedness.

Illustrations are auto-generated and may be placeholders. They can be refreshed to match the narration.
Locate Recent Earthquakes
Earthquake catalogs record where and when earthquakes occur. Each entry usually includes latitude, longitude, depth, time, and magnitude. Scientists plot these data on maps to see spatial patterns. On a recent-earthquake map, a dot marks an epicenter, the point on Earth’s surface directly above where the rupture began. Dot size or color may represent magnitude or depth, so always read the map key. For example, students might plot a magnitude 4.2 earthquake at 34° N, 118° W near Los Angeles and a magnitude 5.0 earthquake near Alaska. A larger map symbol should not be interpreted as a physically larger epicenter; it represents a data value. The map’s date range also matters. A seven-day map shows recent activity, but it does not reveal all long-term earthquake patterns.

Identify Patterns Near Plate Boundaries
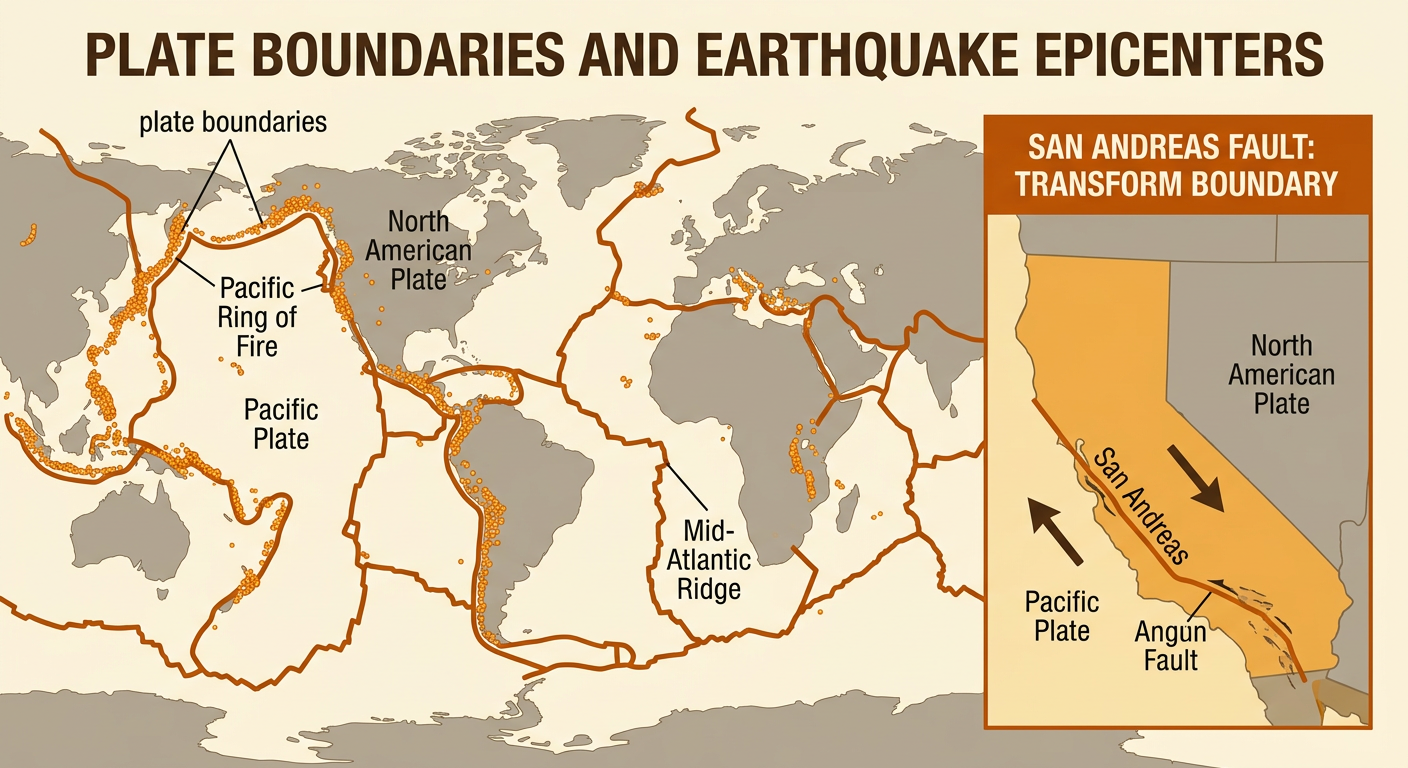
Earthquakes are not randomly distributed across Earth. Many form narrow belts along tectonic plate boundaries, where plates collide, separate, or slide past one another. A map of earthquake epicenters outlines features such as the Pacific Ring of Fire and the Mid-Atlantic Ridge. For example, many earthquakes occur along California’s San Andreas Fault, where the Pacific Plate and North American Plate slide horizontally past each other. Earthquakes can also occur within plates because old faults may be reactivated by stress. To identify a pattern, compare an earthquake map with a plate-boundary map and look for clusters, lines, and gaps. This comparison provides evidence that plate motion influences earthquake locations. However, a boundary line does not show exactly where or when the next earthquake will happen.
Compare Magnitude and Frequency
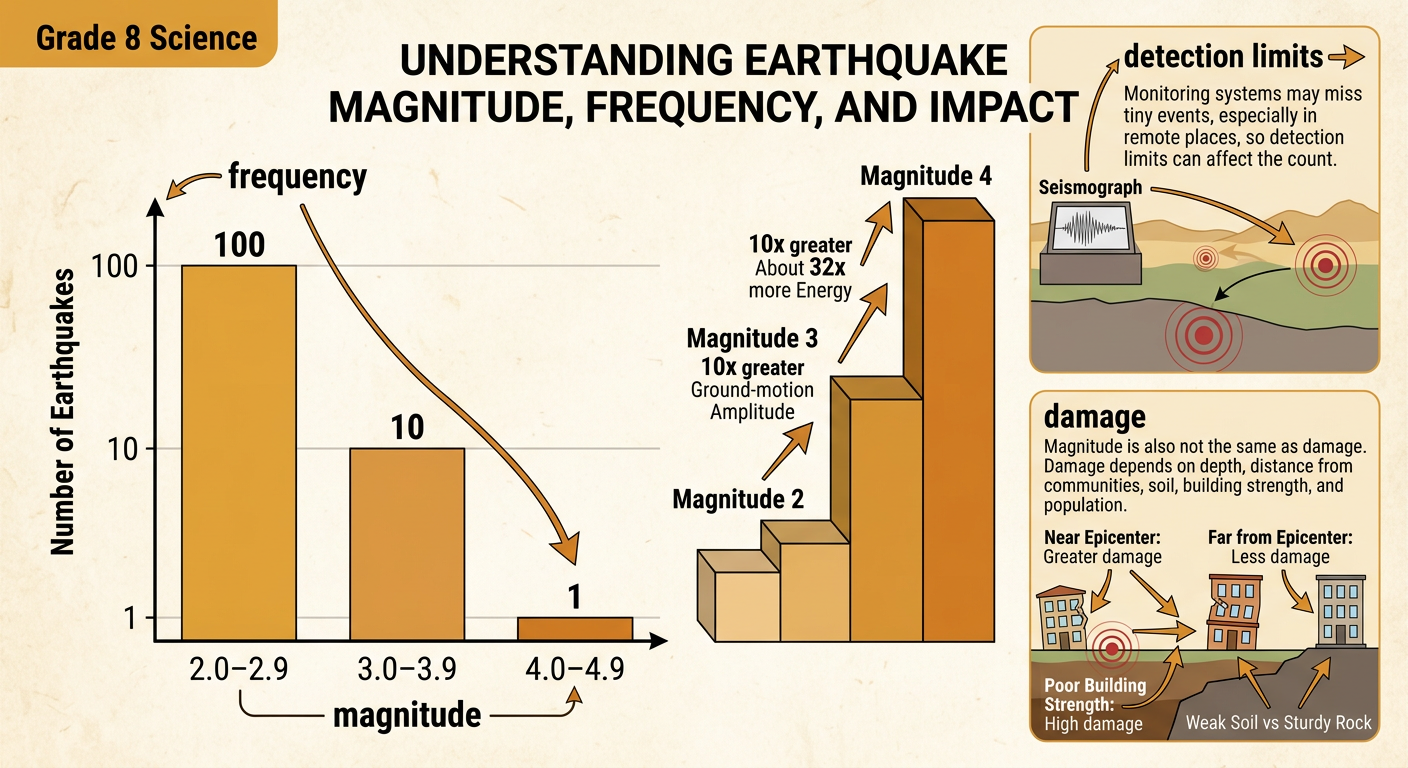
Magnitude measures the energy released by an earthquake. The magnitude scale is logarithmic, so an increase of one whole magnitude represents 10 times greater ground-motion amplitude and about 32 times more energy. Large earthquakes are much less frequent than small ones. In a simplified earthquake catalog, students might find 100 earthquakes from magnitude 2.0 to 2.9, 10 from 3.0 to 3.9, and one from 4.0 to 4.9. A bar graph makes this frequency pattern easy to compare. Detection limits must also be considered because monitoring systems may miss very small earthquakes, especially in remote areas. Magnitude is not the same as damage. Damage also depends on depth, distance from communities, local soil, building strength, and population. A moderate shallow earthquake near a city may cause more harm than a larger, deeper event far away.
Forecast Risk, Not Exact Events
Scientists can forecast earthquake risk, but they cannot predict the exact time, location, and magnitude of a future earthquake. A forecast estimates the probability of an event within an area and time period by using evidence such as past earthquakes, fault locations, plate movement, and ground deformation. For example, a hazard model might estimate a 30% chance of severe shaking in a region during the next 30 years. This does not mean the earthquake will occur exactly 30 years from now, and it does not guarantee that one will occur. After a large earthquake, scientists can also estimate how aftershock probabilities change over the following days and weeks. Forecasts should always include a time span, location, event threshold, and probability. These ranges communicate uncertainty while still helping communities make informed decisions.
Connect Evidence to Preparedness
Hazard data become useful when communities combine them with information about people, buildings, roads, and emergency services. A high-hazard area with many older, unreinforced buildings may face greater risk than an area with earthquake-resistant construction. For example, if a map shows strong-shaking potential near a school, engineers can inspect the building, secure heavy equipment, strengthen weak walls, and improve automatic gas shutoff systems. Officials can also plan evacuation routes, protect water lines and bridges, and practice emergency communication. Families can secure bookcases, store supplies, and practice “Drop, Cover, and Hold On.” No technology can prevent an earthquake, but building codes, retrofitting, early-warning systems, and preparedness plans can reduce injuries and damage. Decisions should consider which neighborhoods have the greatest exposure and the fewest resources for recovery.
