
Mapping Evidence for Plate Tectonics
Students analyze maps of earthquakes, volcanoes, seafloor ages, and landforms to identify plate boundaries and explain how Earth’s internal processes shape its surface.

Illustrations are auto-generated and may be placeholders. They can be refreshed to match the narration.
Patterns on Earth’s Surface
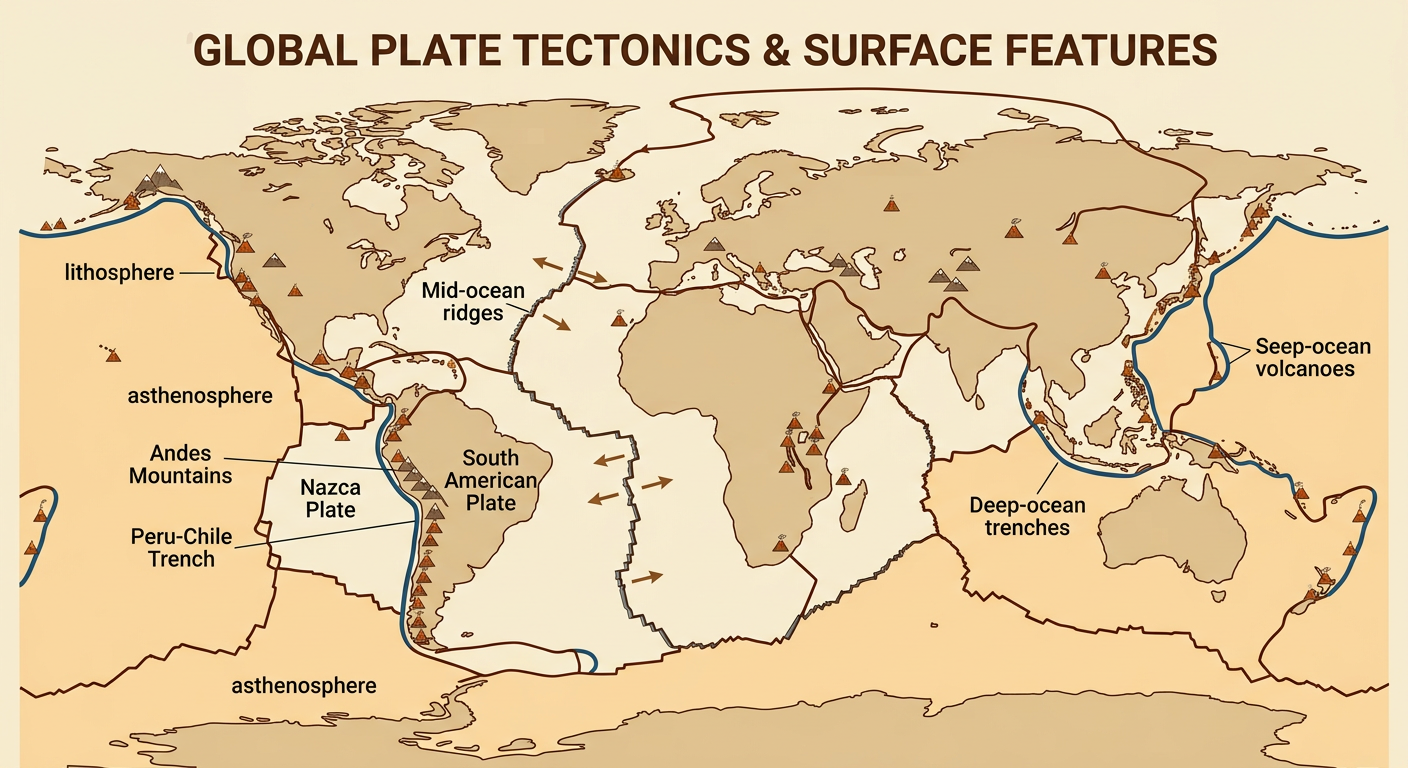
Earth’s major surface features are not randomly distributed. Mountain ranges, deep-ocean trenches, mid-ocean ridges, earthquakes, and volcanoes form long, connected patterns. These patterns often mark the edges of tectonic plates, which are rigid sections of the lithosphere moving over the softer asthenosphere. For example, the Andes Mountains and the Peru-Chile Trench run roughly parallel along the western edge of South America. This arrangement formed where the oceanic Nazca Plate moves beneath the continental South American Plate. Plate interiors generally have fewer earthquakes and volcanoes than plate boundaries, although exceptions such as hot spots occur. Scientists compare several kinds of mapped evidence because one data set alone may be incomplete. When landforms, earthquake locations, volcanoes, and seafloor data align, they provide strong evidence for the location and type of a plate boundary.
Mapping Earthquakes and Volcanoes
Earthquake and volcano maps reveal narrow zones of tectonic activity. Earthquakes occur when rocks suddenly slip along faults, while many volcanoes form where magma rises near plate boundaries. Along the Mid-Atlantic Ridge, shallow earthquakes and volcanoes occur where plates move apart. Around the Pacific Ocean, the Ring of Fire contains many volcanoes and earthquakes near convergent boundaries. Earthquake depth adds important information. At a subduction zone, earthquakes begin near an ocean trench and become progressively deeper beneath the overriding plate, tracing the descending slab. For example, earthquakes beneath Japan range from shallow near the trench to deep farther west. Volcanoes form above the sinking slab, but usually not directly at the trench. By plotting event location, depth, and frequency, scientists can infer both the position of a boundary and the direction in which a plate descends.

Seafloor-Age Evidence
Maps of seafloor age provide evidence that new oceanic crust forms at mid-ocean ridges. Molten material rises at a ridge, cools, and becomes basaltic crust. As more crust forms, older seafloor moves away on both sides. Therefore, the youngest rocks lie along the ridge axis, and progressively older rocks occur farther away in roughly symmetrical bands. For example, maps of the South Atlantic show young crust along the Mid-Atlantic Ridge and older crust toward South America and Africa. This pattern supports seafloor spreading and helps explain why the continents have moved apart. Oceanic crust is generally younger than about 200 million years because old seafloor is eventually recycled into the mantle at subduction zones. Scientists can estimate spreading rates by dividing the distance from a ridge by the measured age of the crust at that location.

Identifying Plate Boundaries
Scientists classify plate boundaries by combining mapped patterns with the direction of plate motion. At divergent boundaries, plates move apart, producing mid-ocean ridges or continental rift valleys, shallow earthquakes, and volcanism. At convergent boundaries, plates move together. Oceanic subduction creates a trench, earthquakes ranging from shallow to deep, and a volcanic arc. Continental collision produces high mountain ranges and strong earthquakes but usually little volcanism. At transform boundaries, plates slide horizontally past one another, causing shallow earthquakes without creating or destroying much crust. California’s San Andreas Fault is a transform boundary between the Pacific and North American plates. A straight line of shallow earthquakes with no trench or volcanic arc supports that classification. Because some features appear at more than one boundary type, the most reliable identification uses multiple clues, including earthquake depth, volcano location, seafloor age, landforms, and motion arrows.

Modeling Plate Motion
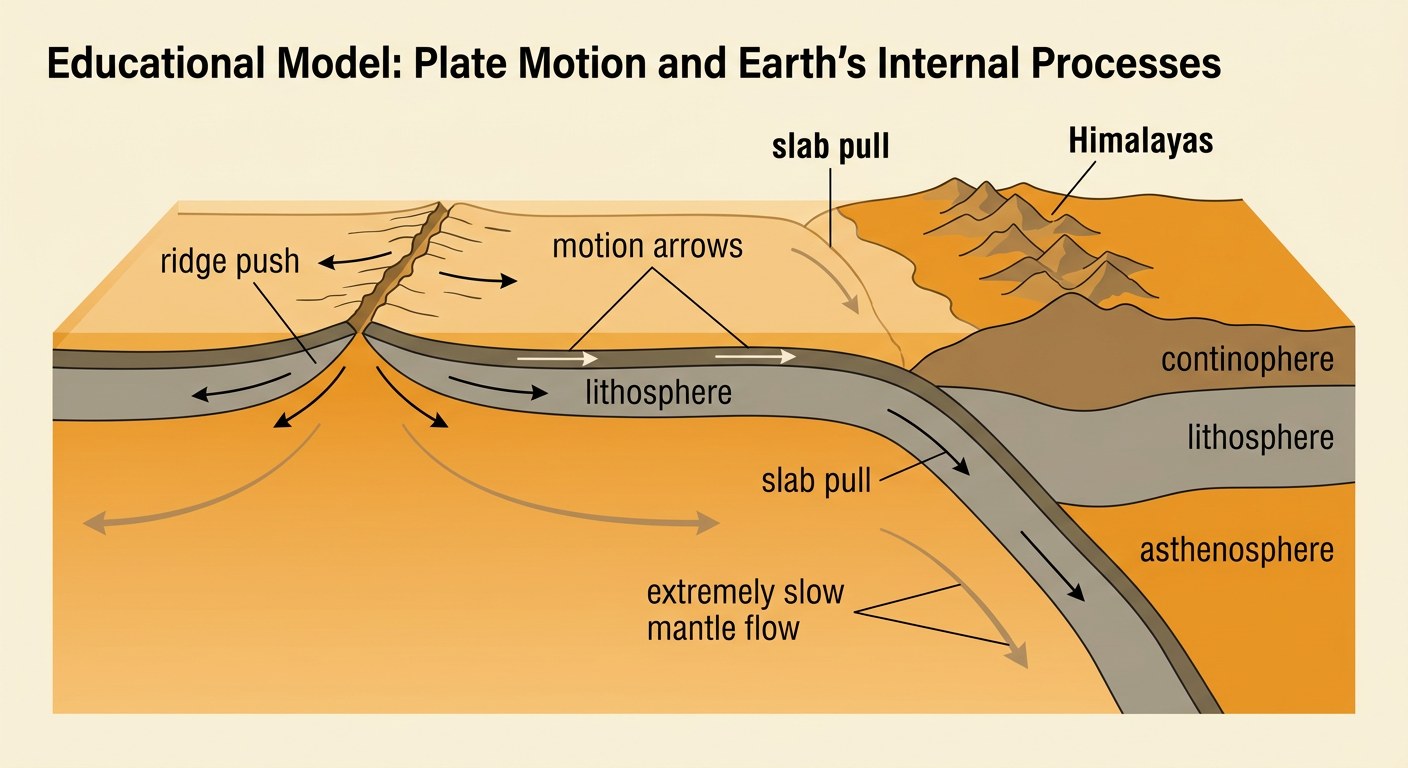
A scientific model connects plate motion to processes inside Earth. Heat from Earth’s interior contributes to slow movement in the mantle, while gravity-driven slab pull and ridge push help move tectonic plates. Slab pull occurs when cold, dense oceanic lithosphere sinks at a subduction zone and pulls the rest of the plate behind it. Ridge push occurs as elevated lithosphere near a mid-ocean ridge moves downslope under gravity. At the surface, these motions create and reshape features. New ocean floor forms at ridges, trenches develop where plates subduct, and mountains rise where plates converge. For example, the Himalayas continue to rise as the Indian Plate collides with the Eurasian Plate. A useful model should include the lithosphere, asthenosphere, motion arrows, and resulting surface features. It should also show that mantle flow is extremely slow and does not resemble rapid boiling.
Evidence-Based Explanation
An evidence-based explanation should make a claim, cite mapped evidence, and explain the scientific reasoning that connects them. Suppose an unknown boundary has a deep-ocean trench, a nearby chain of volcanoes, and earthquakes that become deeper toward the continent. A strong claim is that the boundary is an oceanic-continental convergent boundary. The evidence includes the parallel trench and volcanic chain, the pattern of increasing earthquake depth, and old oceanic crust approaching the trench. The reasoning is that dense oceanic lithosphere sinks beneath continental lithosphere, producing earthquakes along the descending slab. Water released from the slab promotes melting in the mantle above it, and magma rises to form volcanoes. The explanation should refer to specific map locations, symbols, distances, or age patterns rather than saying only that the maps “look similar.” It should also acknowledge uncertainty if evidence is missing or conflicting.
