Mapping Water on Earth
Students use maps and images to identify where water is found on Earth and classify examples as liquid water or solid ice.

Illustrations are auto-generated and may be placeholders. They can be refreshed to match the narration.
Notice Water on a World Map
A world map is a picture of Earth shown on a flat surface. On many maps, blue areas represent water, while green or brown areas represent land. Look at the large blue spaces between the continents. These are oceans. Oceans cover most of Earth’s surface. You may also notice thin blue lines and small blue shapes on the land. These can represent rivers and lakes. A map key explains what the colors and symbols mean. For example, find North America on the map. The large blue area east of North America is the Atlantic Ocean. Images and map labels help us identify where water is located, even when a place is far away from us.

Read About Earth’s Water
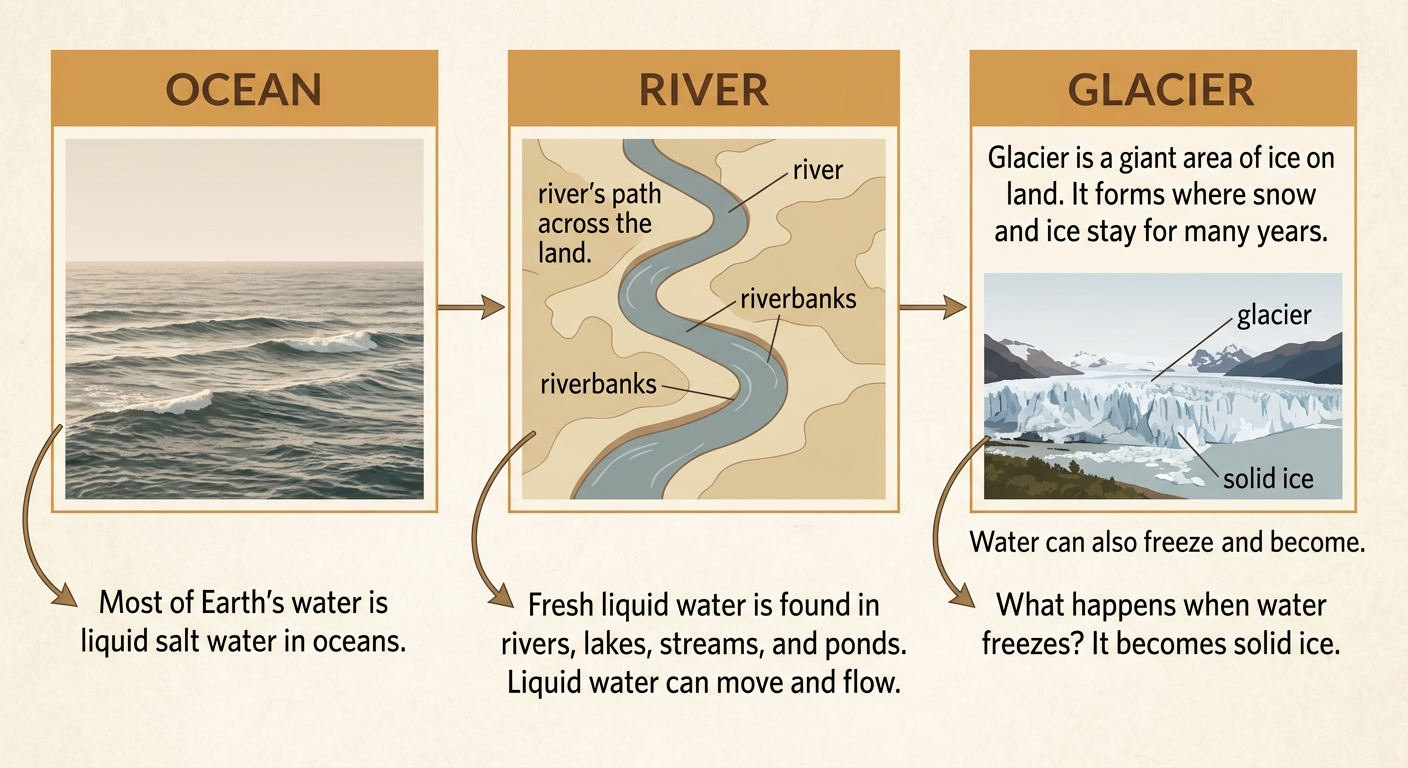
Water is found in many places on Earth. Most of it is liquid salt water in oceans. Liquid fresh water is found in rivers, lakes, streams, and ponds. Water can also be solid. When water freezes, it becomes ice. Large areas of ice called glaciers form on land where snow and ice remain for many years. Words give us facts, while maps and photographs help us see what those facts mean. For example, a text may say that a river flows across land. A photograph can show the river’s moving water and its banks. A map can show where the river begins, the path it follows, and where it ends.
Find Oceans, Rivers, Lakes, and Glaciers
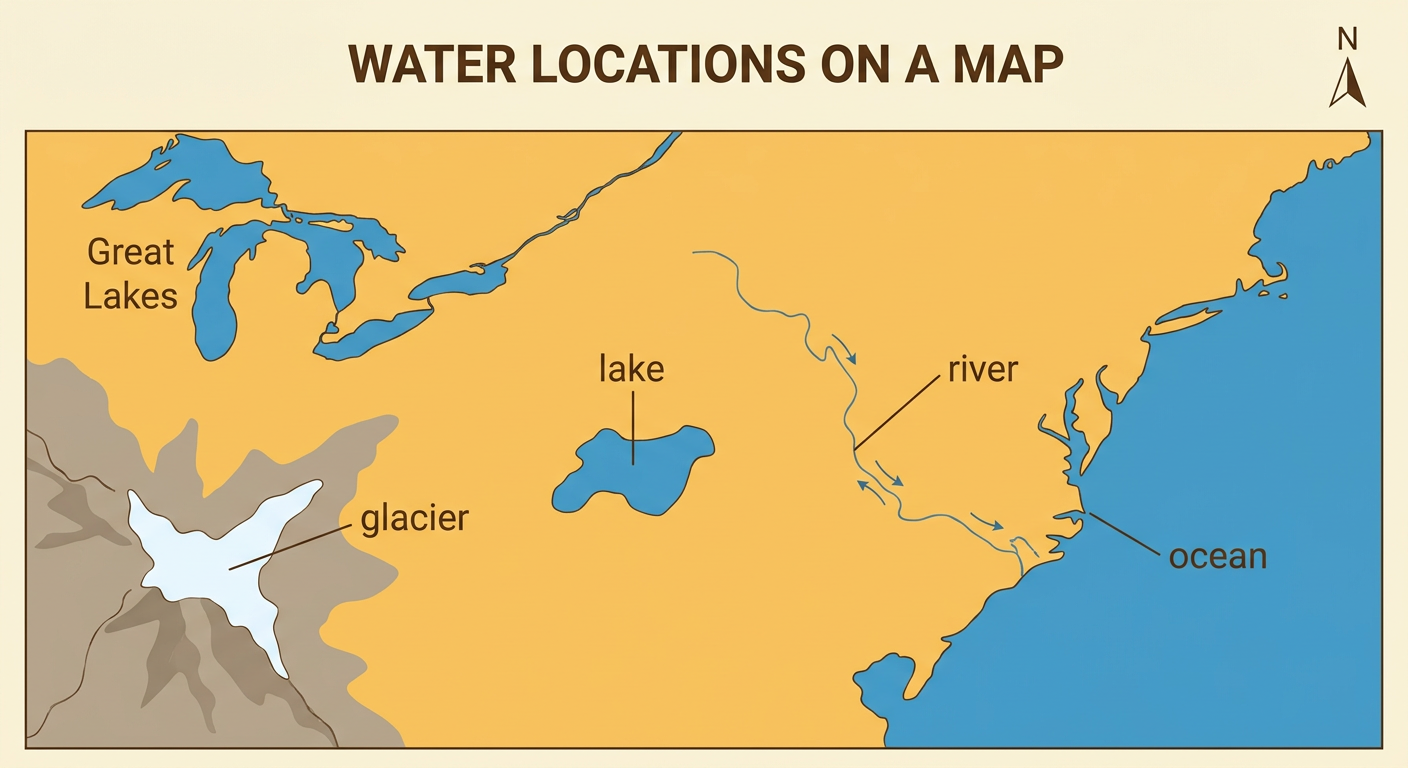
Maps use shapes, colors, and labels to show different water locations. An ocean is a huge body of salt water surrounding continents. A river is flowing water that follows a path across land. A lake is a body of water surrounded by land. A glacier is a large mass of ice that moves very slowly over land. On a map, an ocean appears as a wide area beside land. A river often looks like a thin, winding line. A lake looks like a blue shape inside the land. A glacier may be shown as a white or pale blue area in a cold region. For example, the Great Lakes appear as large blue shapes along part of the border between the United States and Canada.
Sort Liquid Water and Solid Ice
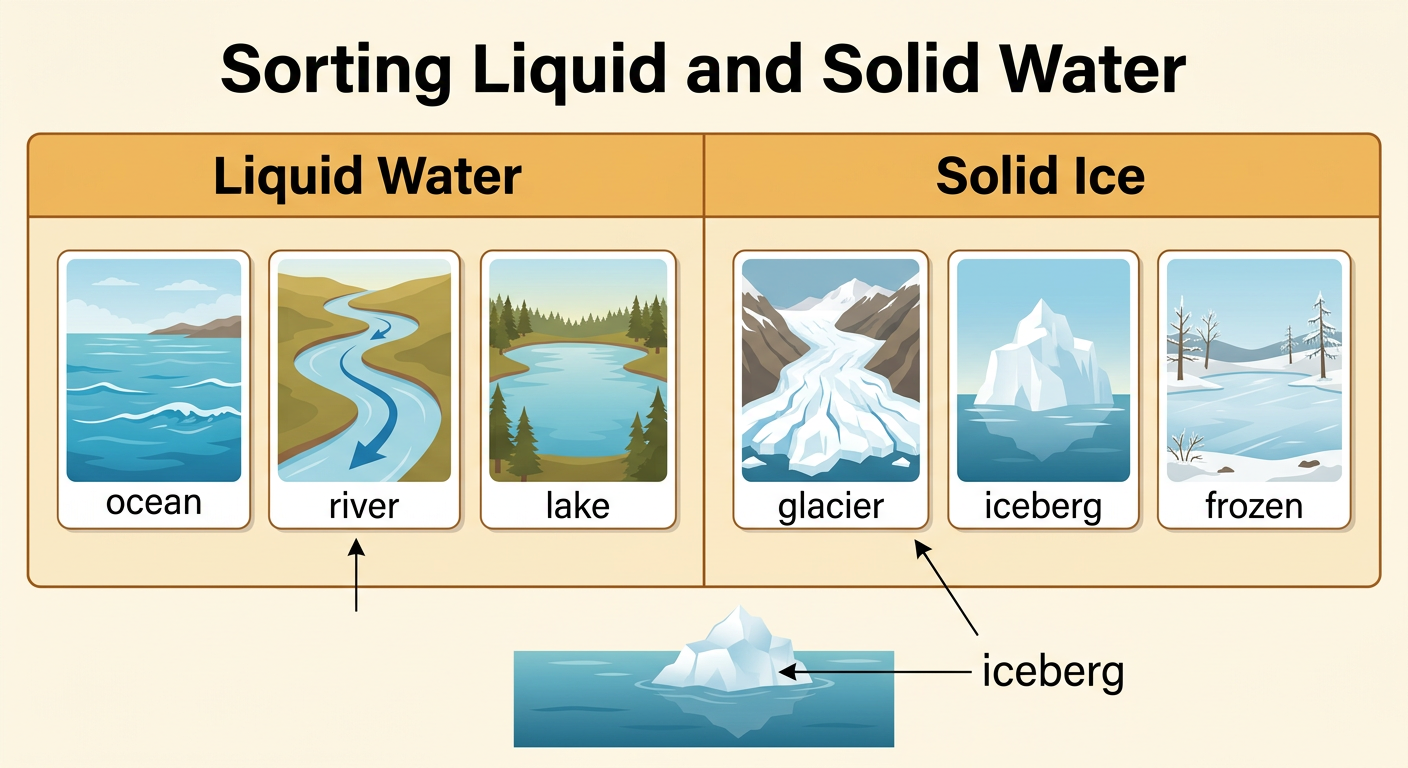
Water on Earth can be liquid or solid. Liquid water flows and takes the shape of its container or the land around it. Oceans, rivers, lakes, ponds, and streams usually contain liquid water. Solid water is ice. Glaciers, icebergs, and frozen lake surfaces are examples of solid ice. An iceberg is a piece of ice floating in liquid ocean water, so one photograph can show both states. To sort examples, first name the water location. Then ask, “Does it flow as liquid water, or is it frozen into solid ice?” For example, place a river card under “Liquid Water.” Place a glacier card under “Solid Ice.” Remember that some places can change when temperatures rise or fall.
Create a Water-Location Picture Graph
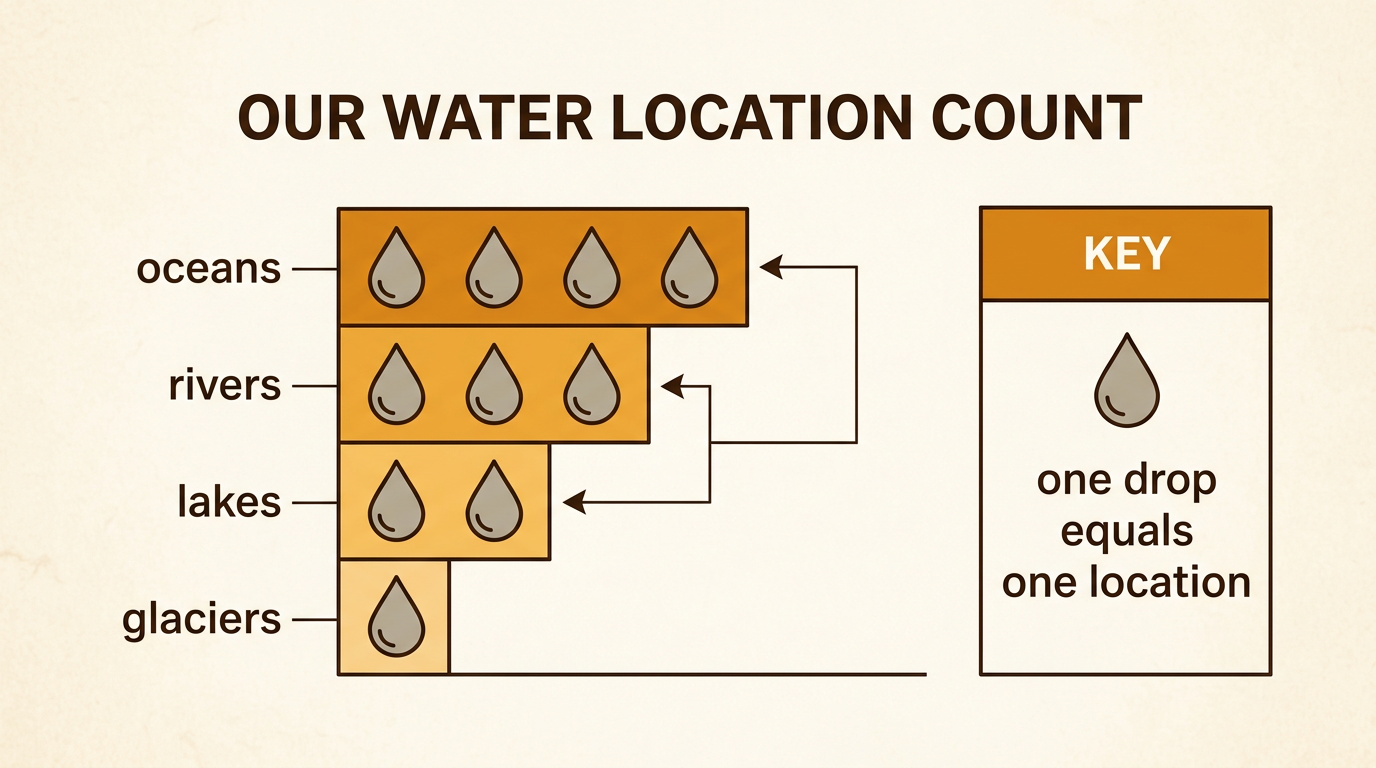
A picture graph can show how many water locations you found on maps and photographs. Make four categories: oceans, rivers, lakes, and glaciers. Count each example, then draw one water-drop picture for each location. Include a key that says, “One drop equals one location.” Suppose you find four oceans, three rivers, two lakes, and one glacier. The ocean row should have four drops, and the glacier row should have one drop. Compare the rows to answer questions. Which category has the most locations? Oceans have the most in this example. How many more rivers than lakes are shown? Three rivers minus two lakes equals one, so the graph shows one more river than lake. Check that every picture matches one counted location.
Share Evidence and Review
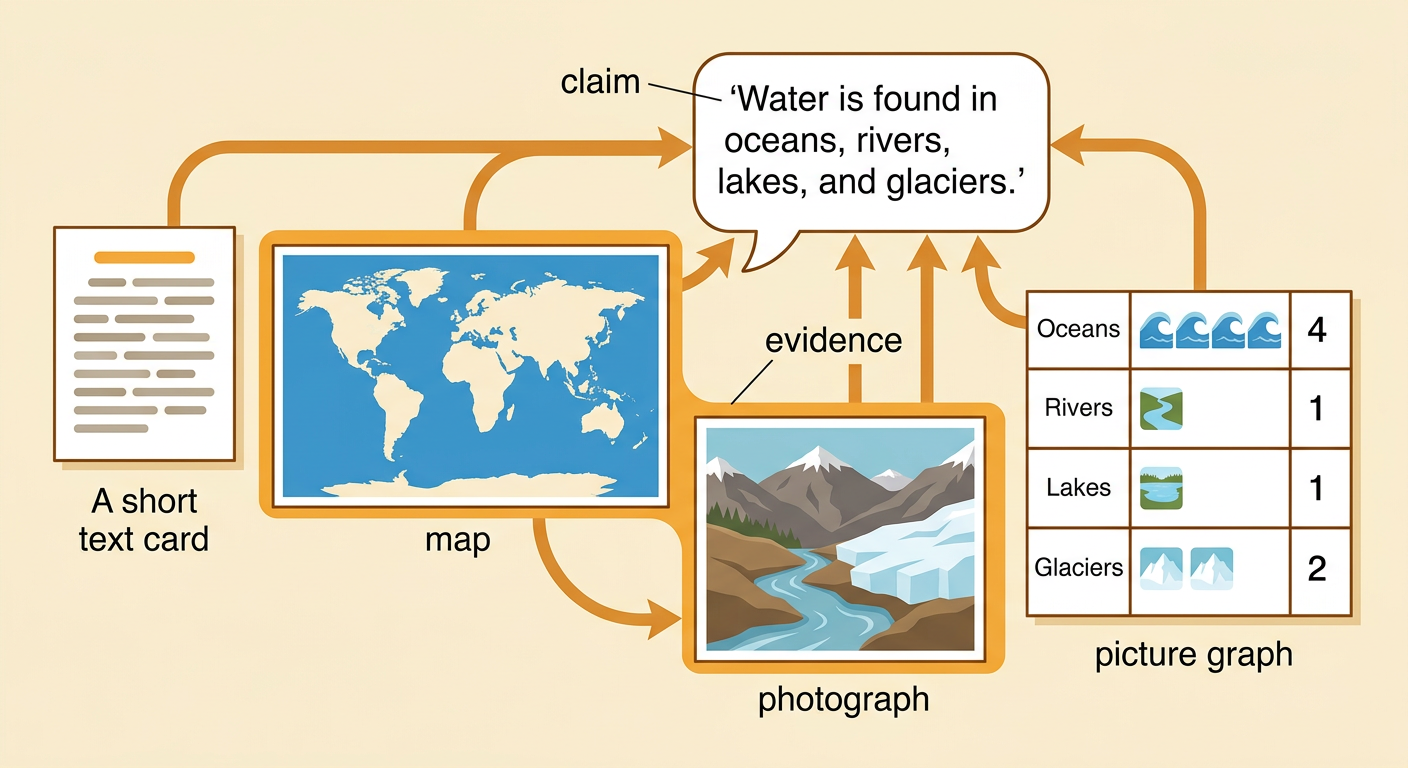
Scientists use evidence from texts, maps, graphs, and photographs to explain ideas. Share one claim about where water is found and support it with evidence. You might say, “Water is found in oceans, rivers, lakes, and glaciers. The map shows blue oceans around the continents, and the photograph shows ice in a glacier.” Explain how an image helped you understand the text. You could say that the river photograph showed water flowing between two banks. Then use your picture graph as number evidence. For example, “My graph shows four ocean locations, which is more than any other category.” Review the main idea: Earth’s water is found in many places. It can be liquid water in oceans, rivers, and lakes or solid ice in glaciers.