
Matter Is Made of Tiny Particles
Students use observations and models to explain that solids, liquids, and gases are made of particles too small to be seen.

Illustrations are auto-generated and may be placeholders. They can be refreshed to match the narration.
Observing Matter We Cannot See
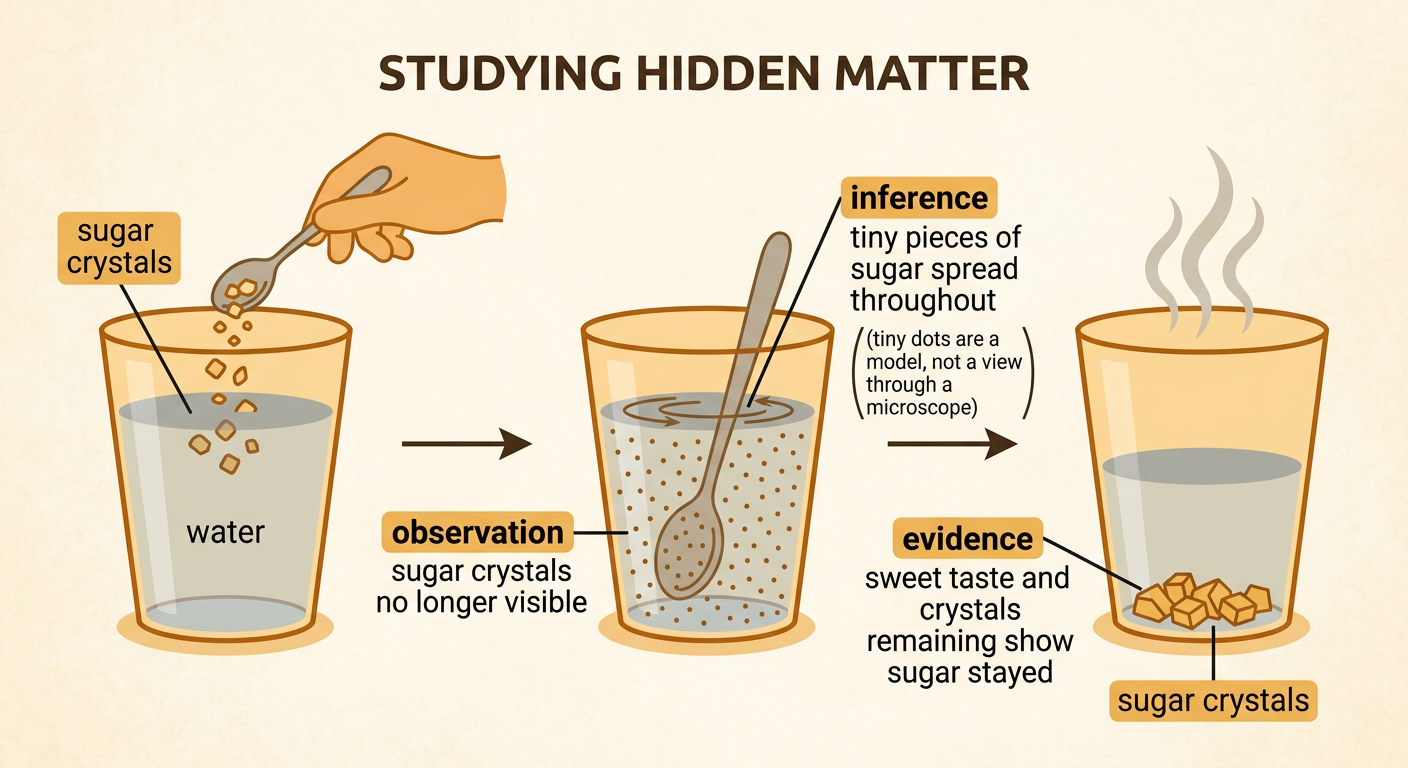
Many parts of matter are too small to see directly, but their effects can be observed. Imagine stirring a spoonful of sugar into a cup of water. The sugar crystals seem to disappear, yet the water tastes sweet. If the water evaporates, sugar remains in the cup. These observations are evidence that the sugar is still present even when we cannot see it. Scientists use observations like appearance, mass, volume, and changes over time to learn about hidden parts of matter. An observation describes what we notice or measure. An inference is an explanation based on those observations. We observe that the crystals are no longer visible, and we infer that tiny pieces of sugar spread throughout the water.
Introducing the Particle Model
A scientific model is a useful representation of an object, event, or idea. In the particle model, all matter is shown as tiny particles. These particles are far too small to see with our eyes, so diagrams use circles or dots to represent them. The circles are not drawings of the particles’ actual size, color, or exact shape. A drop of water contains an enormous number of particles, even though a model may show only a few. Models help us explain observations and make predictions. For example, a drop of food coloring slowly spreads through water because its particles move among the water particles. The color eventually reaches many parts of the cup. This model explains how matter can spread without being pushed into every location by a spoon.

Modeling Solids, Liquids, and Gases
Solids, liquids, and gases are all matter made of particles, but their particles are arranged and move differently. In a solid, particles stay in closely packed positions and vibrate, helping the solid keep its own shape and volume. In a liquid, particles remain close together but move past one another, so the liquid keeps its volume while taking the shape of its container. In a gas, particles are much farther apart and move freely in all directions. A gas spreads out to fill its container. Consider water: ice keeps the shape of a cube, liquid water changes shape when poured into a bottle, and water vapor spreads through the available space. In a particle diagram, use the same type of particle for each state of water. Change the spacing and movement, not the identity of the particles.

Using Evidence from Inflation and Compression
Inflation and compression provide evidence about gas particles. When air is pumped into a basketball, the ball becomes firm and its measured circumference may increase. The pump adds matter even though the air particles cannot be seen. Those moving particles spread through the ball and push on its inner surface. Gas can also be compressed. In a sealed syringe without a needle, trapping 20 milliliters of air and pushing the plunger to 10 milliliters forces the same amount of air into half the volume. The particles do not shrink; the empty spaces between them become smaller. A simple table can compare plunger position and air volume. This mathematical model reveals a pattern: as trapped air takes up less volume, it pushes back more strongly. Observations and measurements support the explanation that gas is matter made of tiny, moving particles.

Explaining Matter with Particles
A strong scientific explanation includes a claim, relevant evidence, and reasoning that connects the evidence to the claim. A useful claim is: Matter is made of particles too small to be seen. Evidence may include sugar remaining after dissolved water evaporates, food coloring spreading through water, or trapped air pushing back when compressed. The reasoning explains how the particle model accounts for each observation. For example, sugar particles spread among water particles, so the sugar becomes invisible but is not gone. When water evaporates, the sugar particles remain and form visible crystals again. A labeled particle diagram can support the written explanation. Measurements, such as air volume changing from 20 milliliters to 10 milliliters, add numerical evidence. Scientists compare the model with all available observations and revise it if it cannot explain the data.
