Measure It Right: Selecting and Reading Scientific Tools
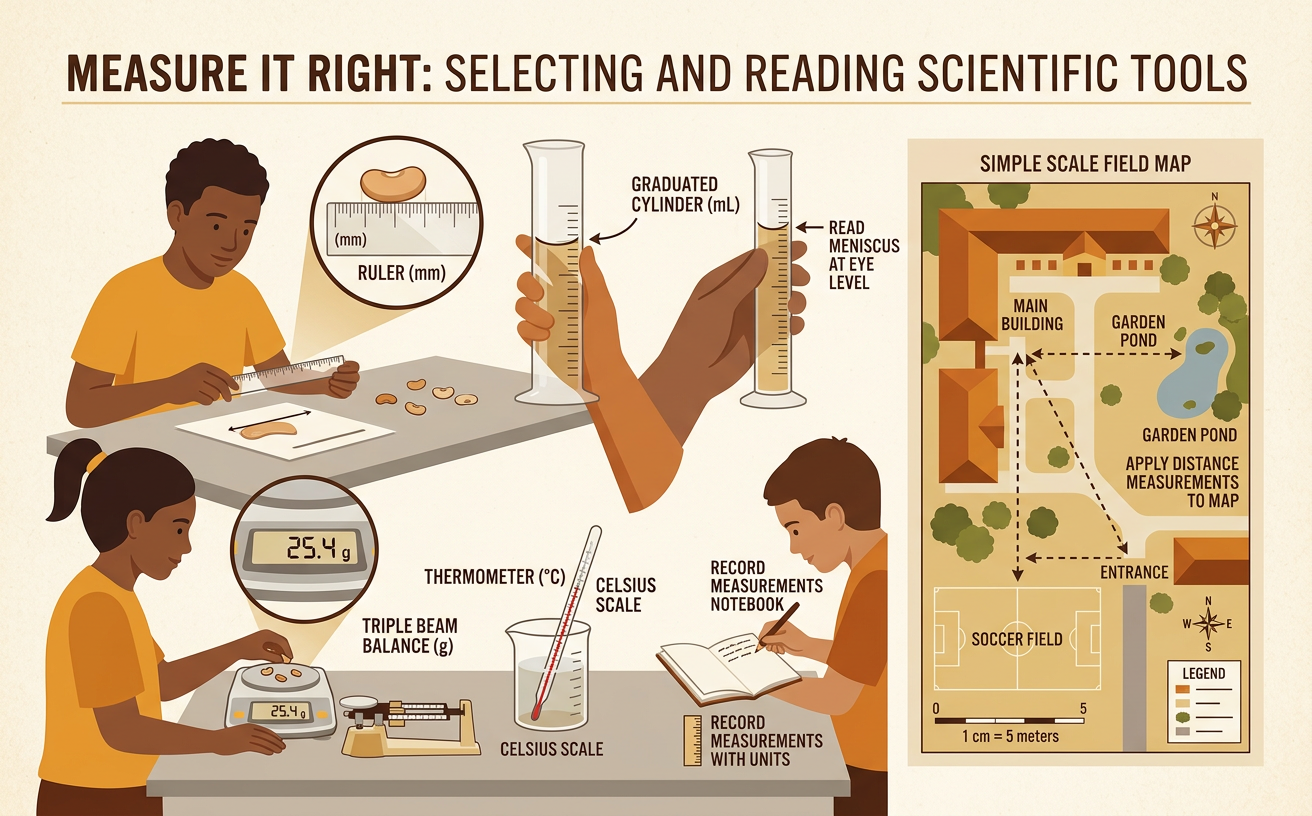
Students select appropriate tools, read metric scales correctly, record measurements with units, and apply distance measurements to a simple scale field map.
Illustrations are auto-generated and may be placeholders. They can be refreshed to match the narration.
Measurement, Units, and Tool Choice
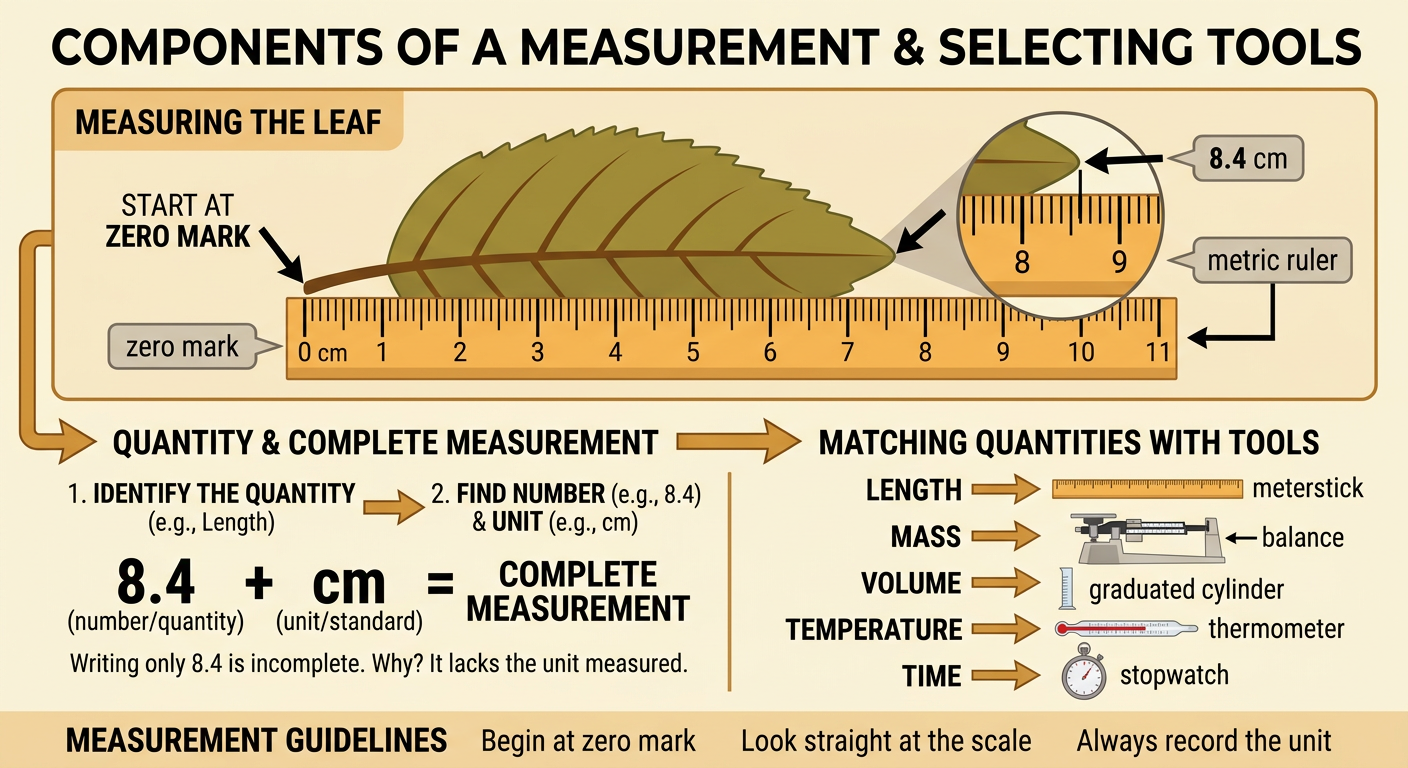
A measurement combines a number with a unit. The number tells how much, and the unit provides a shared standard for comparison. Before measuring, identify the quantity you need, such as length, mass, volume, temperature, or time. Then choose a tool designed for that quantity. A meterstick measures the length of a table, while a balance measures its mass. Check that the tool’s range includes the expected value and that its markings provide enough precision. Begin at the correct zero point, look straight at the scale, and record the unit with the number. For example, to measure a leaf’s length, place its base at the zero mark of a metric ruler. If its tip reaches 8.4 centimeters, record 8.4 cm, not just 8.4.
Length, Mass, Volume, Temperature, and Time
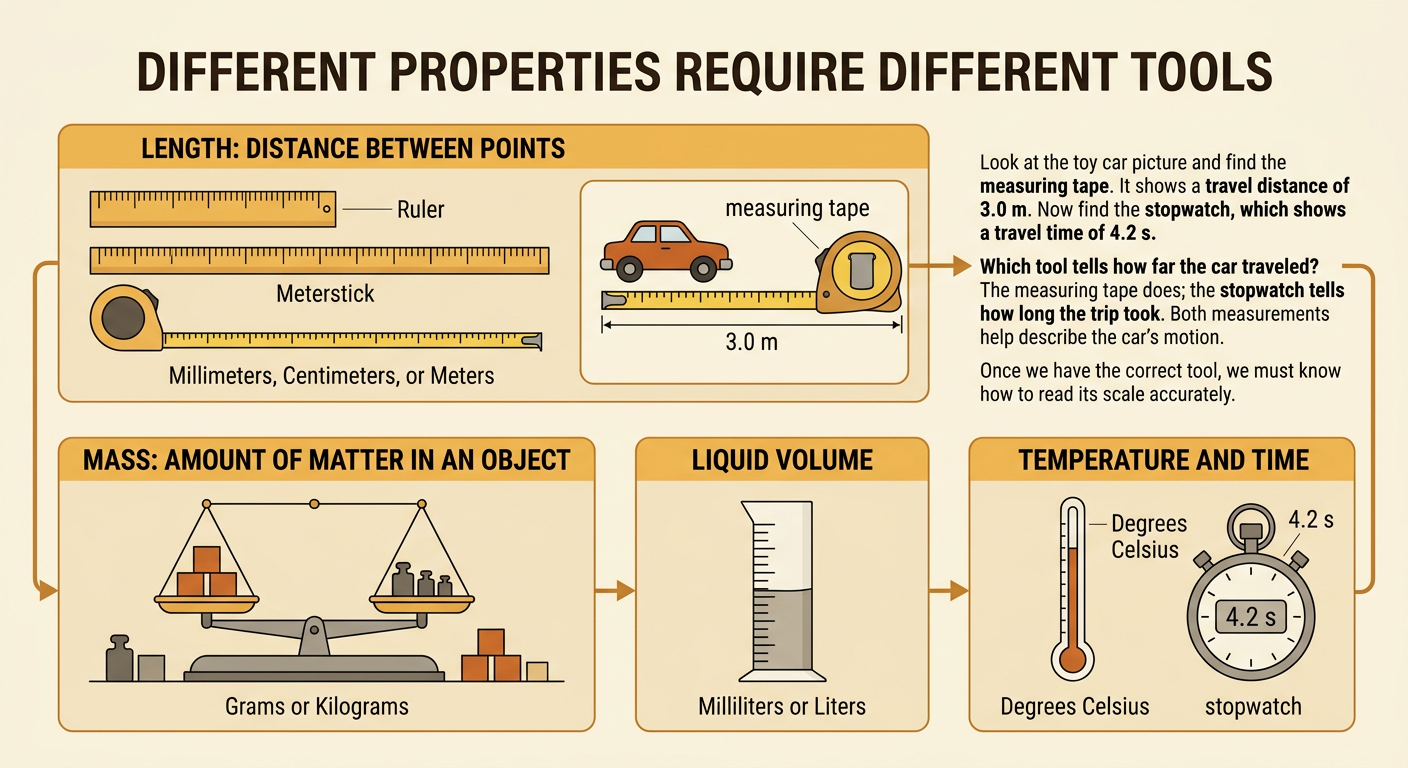
Scientists measure different properties with different tools and metric units. Length is the distance between points and is commonly measured in millimeters, centimeters, or meters with a ruler, meterstick, or measuring tape. Mass is the amount of matter in an object and is measured in grams or kilograms with a balance. Liquid volume is measured in milliliters or liters, often with a graduated cylinder. Temperature is measured in degrees Celsius with a thermometer. Time intervals are measured in seconds or minutes with a stopwatch. For example, an investigation of a toy car might use a measuring tape to find a travel distance of 3.0 m and a stopwatch to find a travel time of 4.2 s. Both measurements are needed to describe the car’s motion.
Reading Scales and Estimating Between Marks
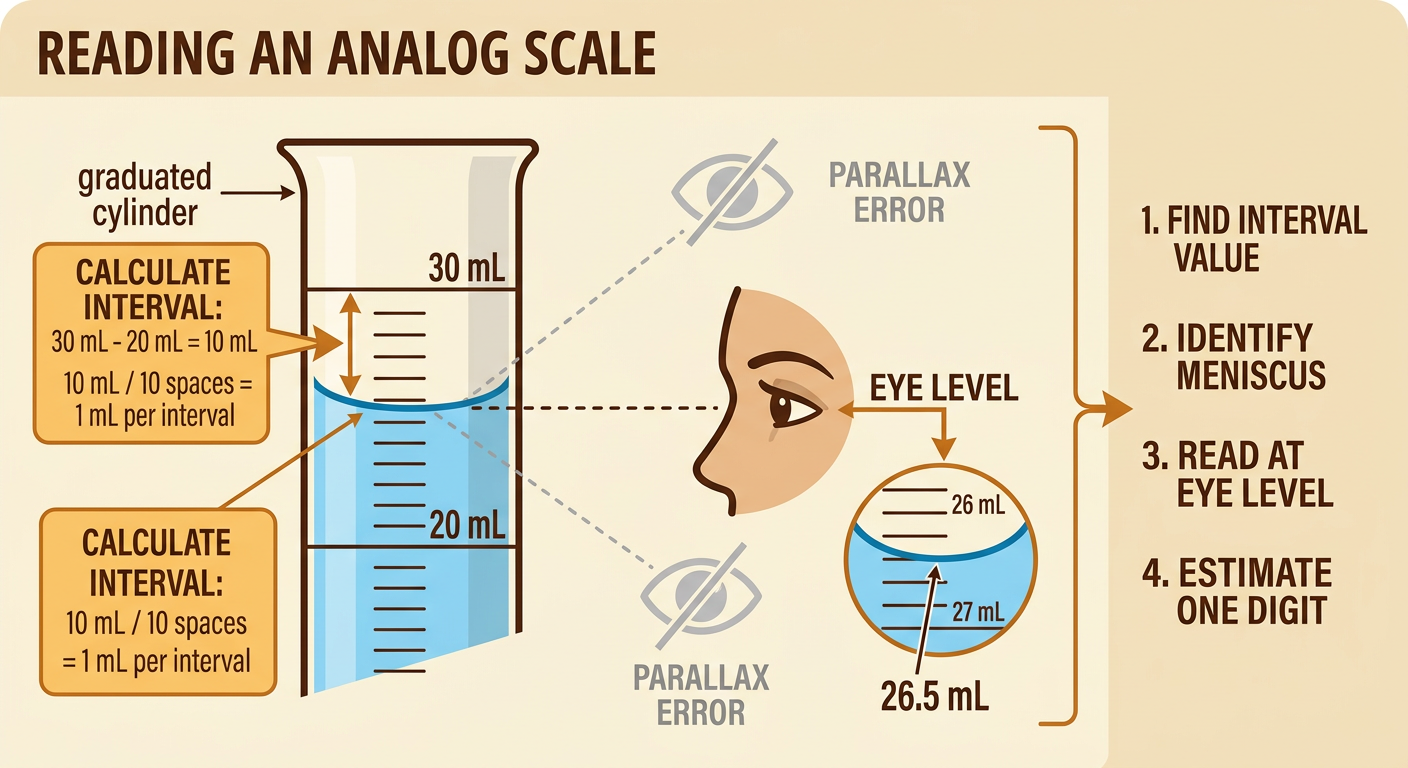
To read an analog scale, first determine the value of each interval. Subtract the values of two numbered marks, then divide by the number of equal spaces between them. Next, locate the measurement and estimate one digit beyond the smallest marked division when the tool allows it. Always view the scale straight on to avoid parallax error, which happens when the apparent position changes because your eye is off to one side. Suppose a graduated cylinder has numbered marks at 20 mL and 30 mL with ten equal spaces between them. Each space represents 1 mL. If the bottom of the liquid’s meniscus lies about halfway between 26 mL and 27 mL, record approximately 26.5 mL. Read the bottom of a concave water meniscus at eye level.
Recording Values with Correct Metric Units
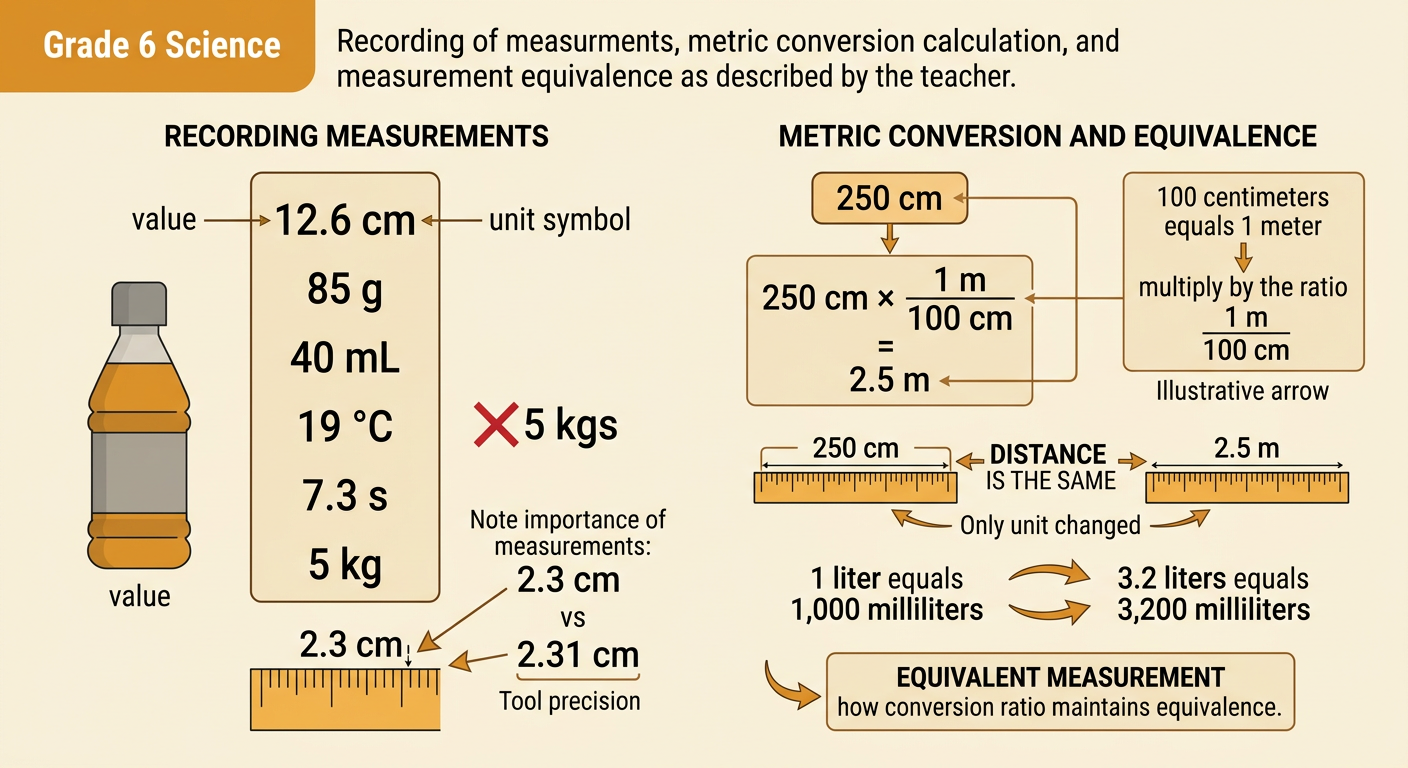
Every recorded measurement must include a value and the correct unit symbol. Write 12.6 cm, 85 g, 40 mL, 19 °C, or 7.3 s rather than a number alone. Unit symbols are not plural, so write 5 kg, not 5 kgs. Keep the precision of the recorded value consistent with the tool’s scale. Metric units can be converted using ratios. Because 100 centimeters equal 1 meter, a 250 cm distance can be converted by multiplying by a ratio equal to one: 250 cm × 1 m/100 cm = 2.5 m. The centimeter units cancel, leaving meters. To convert 3.2 L to milliliters, use 1,000 mL/1 L. The result is 3,200 mL. A conversion changes the unit, not the actual quantity measured.
Choosing Tools for Precision and Range
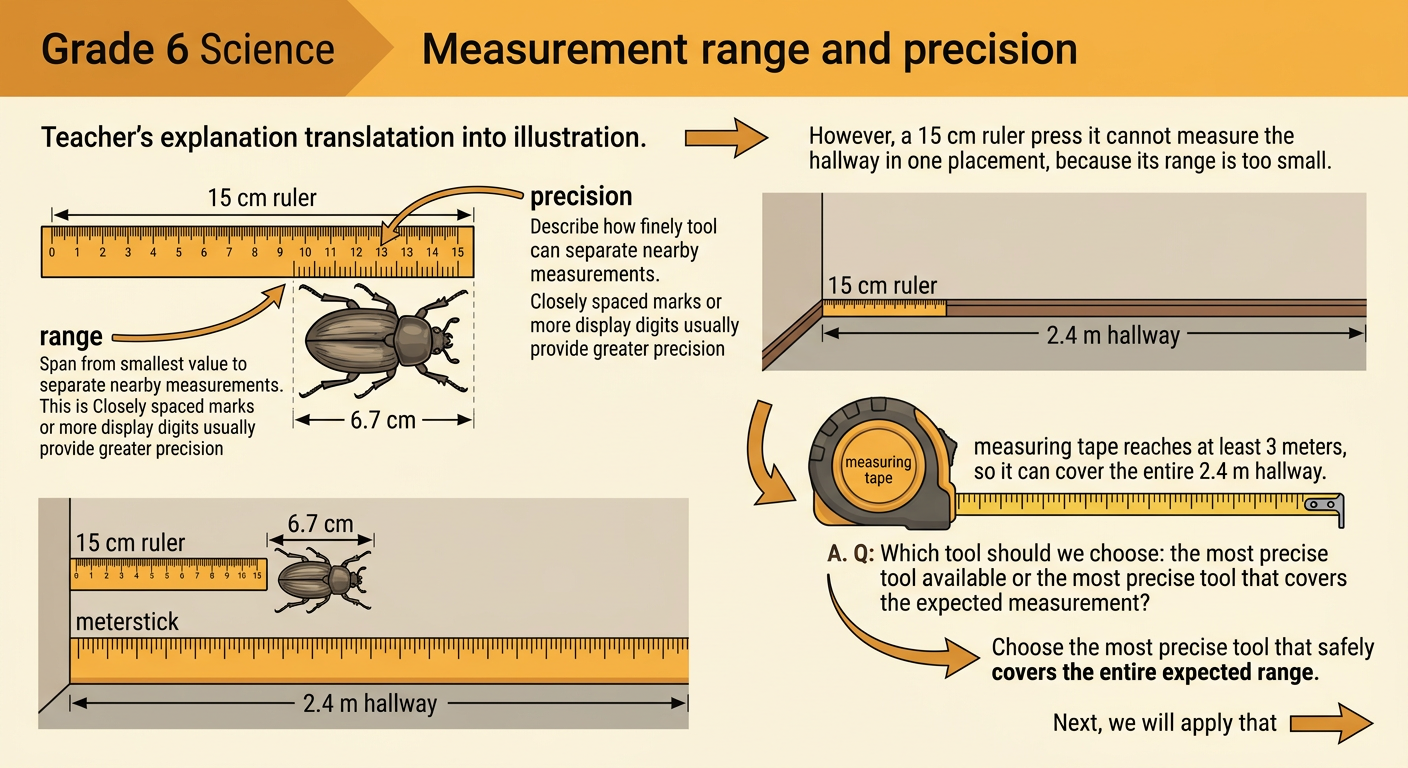
A useful measuring tool must have both a suitable range and suitable precision. Range is the span from the smallest to the largest value a tool can measure. Precision describes how finely a tool can distinguish measurements, often shown by the spacing of its scale marks or the digits on its display. A 15 cm ruler marked every millimeter is more precise for measuring a 6.7 cm beetle model than a meterstick marked every centimeter. However, that ruler cannot measure a 2.4 m hallway in one placement because its range is too small. A measuring tape with a range of at least 3 m is the better choice. Scientists choose the most precise tool that can safely cover the entire expected range. Using a tool beyond its range can produce missing or unreliable data.
Applying Measurements to a Scale Field Map
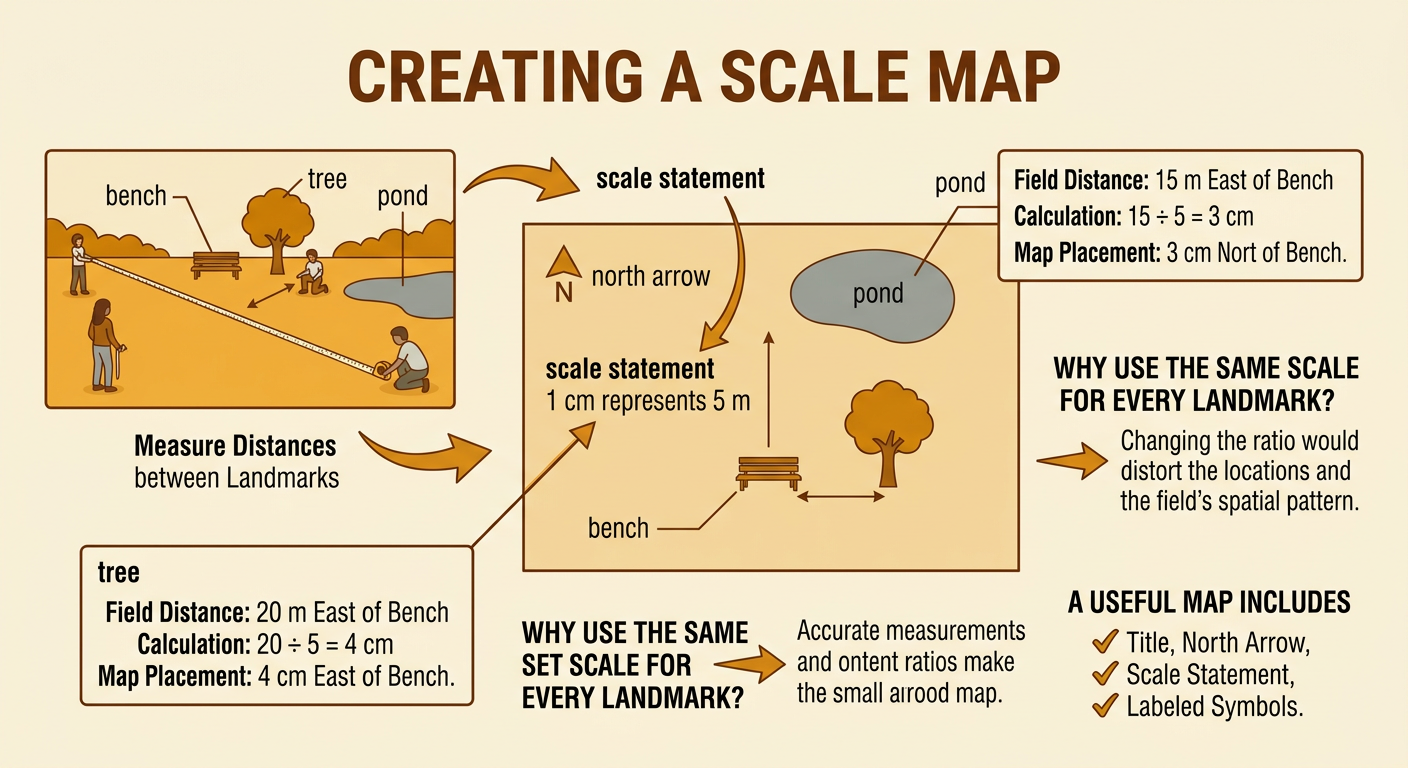
A scale map represents real distances with smaller proportional distances. Begin by choosing fixed landmarks and measuring the straight-line distances between them with an appropriate tool, such as a long measuring tape. Then select a scale that fits the data on the page. If 1 cm on the map represents 5 m in the field, divide each real distance in meters by 5 to find its map length in centimeters. A tree 20 m east of a bench should be plotted 4 cm east of the bench because 20 ÷ 5 = 4. A pond 15 m north of the bench should be plotted 3 cm north. Include a title, north arrow, scale statement, and labeled symbols. Accurate measurements and consistent ratios allow the map to preserve the spatial pattern of the field site.