
Measurement, Vectors, and Motion Graphs
Students use units, vectors, tables, equations, and graphs to describe position, velocity, and acceleration in one-dimensional motion.
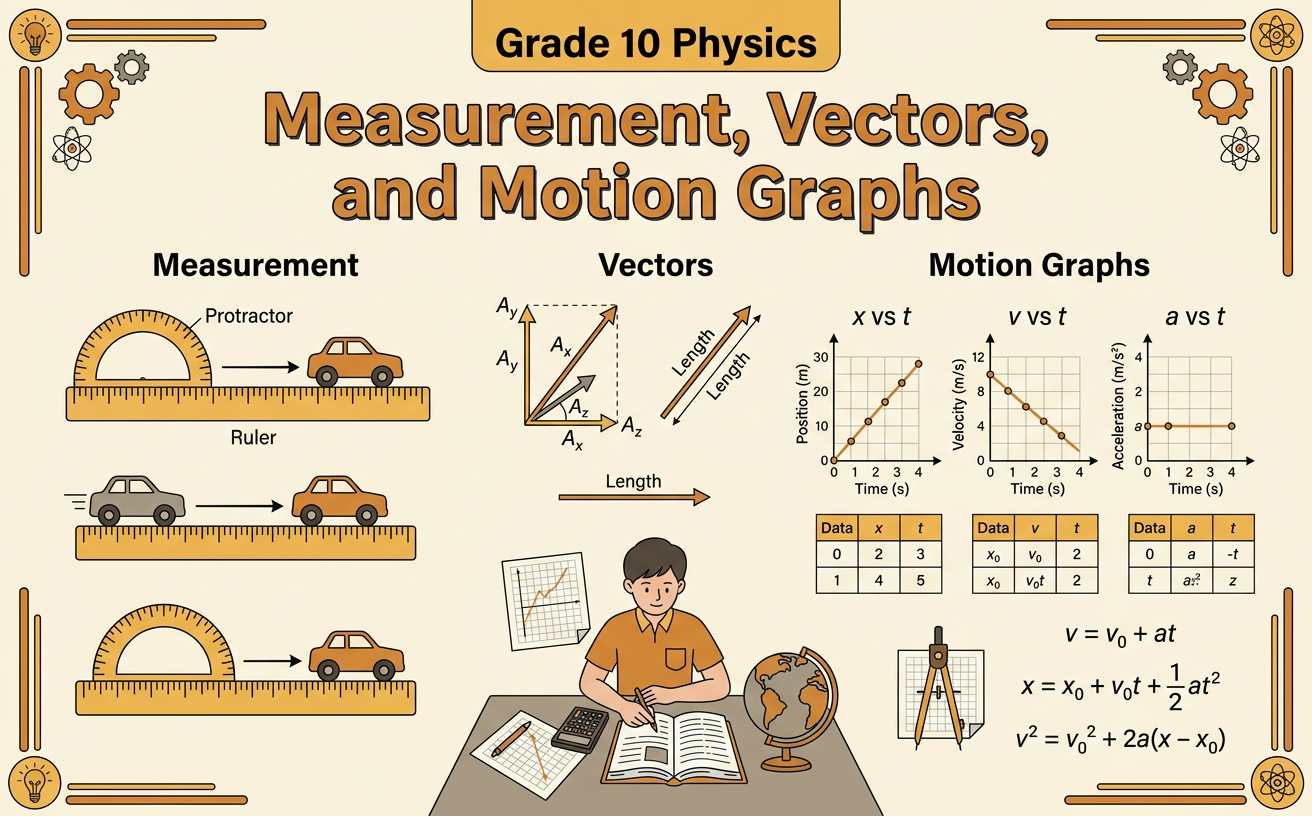
Illustrations are auto-generated and may be placeholders. They can be refreshed to match the narration.
SI Units and Measurement
Measurements combine a number, a unit, and an appropriate level of precision. The International System of Units, or SI, provides shared standards so results can be compared. Motion is commonly measured in meters for position, seconds for time, meters per second for velocity, and meters per second squared for acceleration. Units can also guide calculations. To convert 72 kilometers per hour, multiply by 1,000 meters per kilometer and 1 hour per 3,600 seconds. The unwanted units cancel, giving 20 meters per second. A measured length should reflect the instrument’s precision; a meterstick marked in millimeters supports a more precise measurement than one marked only in centimeters. Modern SI developed from historical efforts, especially during the French Revolution and later international cooperation, to replace inconsistent local units with standards useful for science, engineering, and trade.
Scalars and Vectors
A scalar has magnitude only, while a vector has both magnitude and direction. Time, distance, mass, and speed are scalars. Displacement, velocity, acceleration, and force are vectors. In one-dimensional motion, direction can be represented with positive and negative signs. For example, suppose a student walks 5 meters east and then 2 meters west. The total distance is 7 meters because distance includes the entire path. If east is positive, the displacement is +5 meters − 2 meters = +3 meters, or 3 meters east. A vector can be drawn as an arrow: its length represents magnitude, and its arrowhead represents direction. Always define the positive direction before assigning signs. A negative vector does not mean “less motion”; it means the vector points opposite the chosen positive direction.
Position and Displacement
Position describes an object’s location relative to a chosen origin on a coordinate axis. The symbol x commonly represents one-dimensional position. Displacement is the change in position, calculated as Δx = x final − x initial. For example, a cart begins at x initial = −2 meters and ends at x final = +6 meters. Its displacement is +6 meters − (−2 meters) = +8 meters. The positive sign shows that the change is in the positive direction. Displacement depends only on the initial and final positions, not on the route taken between them. The origin and positive direction must be stated because position values depend on the reference frame. An observer using a different origin may assign different positions to the cart, but both observers will calculate the same displacement if their coordinate axes point in the same direction.
Velocity and Acceleration
Average velocity is displacement divided by elapsed time: average velocity = Δx/Δt. Acceleration is the change in velocity divided by elapsed time: average acceleration = Δv/Δt. Velocity has units of meters per second, and acceleration has units of meters per second squared. Suppose a car’s velocity increases from 5 meters per second east to 17 meters per second east in 4 seconds. Its average acceleration is (17 − 5)/4 = 3 meters per second squared east. Positive acceleration means the velocity changes in the positive direction; it does not always mean an object is speeding up. A westward-moving object with eastward acceleration may slow down. Acceleration also connects motion to force through Newton’s second law: a = F net/m. For the same mass, a larger net force produces a larger acceleration; for the same net force, a larger mass produces a smaller acceleration.
Reading Motion Graphs
Motion graphs translate tables and equations into visual patterns. On a position-time graph, slope represents velocity. A straight line with a positive slope shows constant positive velocity, a horizontal line shows rest, and a curve with an increasing slope shows changing velocity. On a velocity-time graph, slope represents acceleration, while the signed area between the line and the time axis represents displacement. For example, if velocity increases uniformly from 0 to 8 meters per second during 4 seconds, the acceleration is 2 meters per second squared. The displacement equals the triangular area under the line: one-half times 4 seconds times 8 meters per second, or 16 meters. On an acceleration-time graph, the signed area represents change in velocity. Read axis labels and units before interpreting a graph, and compare corresponding time intervals across related graphs.