
Measuring Reaction Energy with Calorimetry
Students use temperature-change data and q = mcΔT to calculate heat transfer, determine the sign of reaction enthalpy, and compare the energy benefits and costs of chemical fuels.
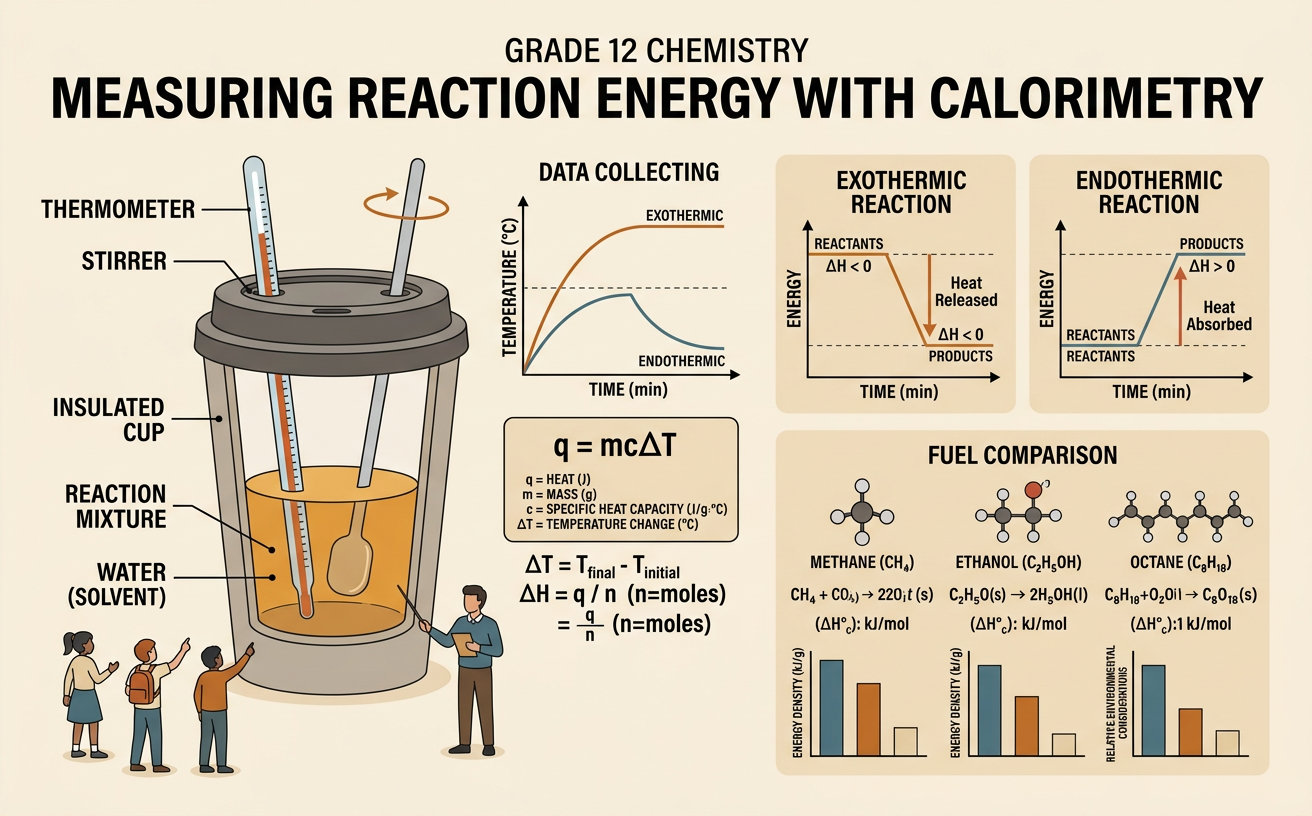
Illustrations are auto-generated and may be placeholders. They can be refreshed to match the narration.
Heat Transfer and System Boundaries
Calorimetry begins by defining the system and surroundings. The system is the chemical reaction being studied, while the surroundings include the solution, calorimeter, and nearby environment that can absorb or release energy. Heat moves from a warmer region to a cooler region until thermal equilibrium is approached. In an insulated coffee-cup calorimeter, scientists assume that little heat escapes to the external environment. Therefore, energy conservation gives qreaction + qsurroundings = 0. For example, when hydrochloric acid reacts with sodium hydroxide, the solution temperature may rise from 22.0°C to 28.5°C. The solution gains heat, so qsurroundings is positive. The reaction loses the same quantity of heat, so qreaction is negative. Clearly defining the boundary prevents the signs and energy quantities from being assigned to the wrong part of the experiment.

Reading Calorimetry Data
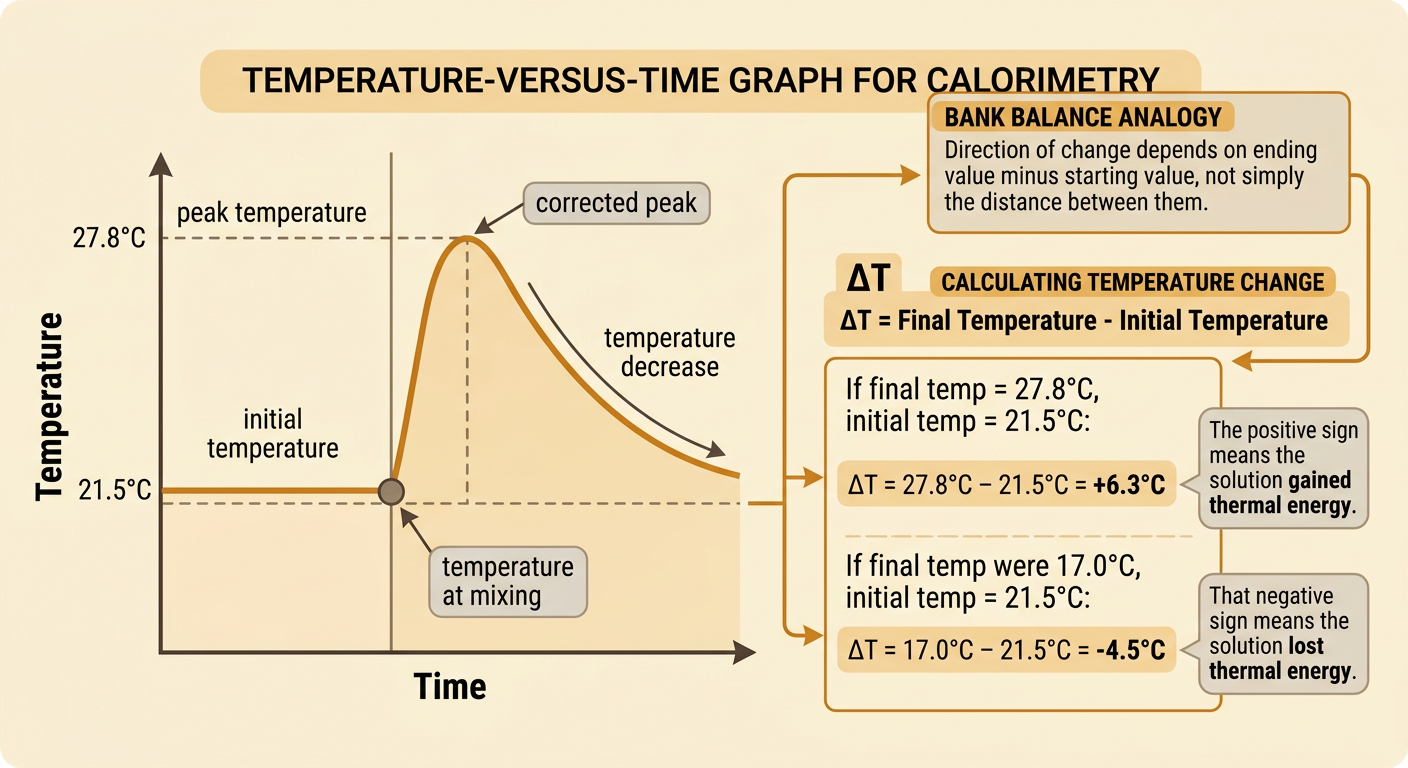
A calorimetry experiment records temperature before and after a reaction. The temperature change is calculated as ΔT = Tfinal − Tinitial, not the larger value minus the smaller value. This order preserves the sign needed to describe the surroundings. Suppose a solution begins at 21.5°C and reaches 27.8°C after a reactant is added. Its temperature change is 27.8°C − 21.5°C = +6.3°C. The positive value shows that the solution gained thermal energy. If the final temperature were 17.0°C instead, ΔT would be −4.5°C, showing that the solution lost thermal energy. When reading a temperature-versus-time graph, use the temperature at mixing and the corrected peak or minimum when provided. Record measurements with units and appropriate precision because mass, temperature, and heat calculations all depend on reliable data.
Calculating Heat with q = mcΔT
The equation q = mcΔT calculates heat absorbed or released by a substance. Here, q is heat in joules, m is mass in grams, c is specific heat capacity in joules per gram-degree Celsius, and ΔT is temperature change in degrees Celsius. Consider 100.0 g of aqueous solution that warms by 6.3°C. Approximating its specific heat capacity as that of water, 4.184 J/(g·°C), gives qsolution = (100.0 g)(4.184 J/(g·°C))(+6.3°C) = +2,636 J, or +2.6 kJ with appropriate significant figures. The grams and degrees Celsius cancel, leaving joules. If heat absorbed by the calorimeter itself is neglected, qreaction = −qsolution = −2.6 kJ. This calculation is a computational energy model based on measured quantities, energy conservation, and an explicitly stated assumption.

Identifying Endothermic and Exothermic Reactions
An exothermic reaction transfers heat from the reaction system to the surroundings, so qreaction is negative and the surrounding solution usually warms. At constant pressure, the reaction enthalpy change, ΔHreaction, is approximately equal to qreaction. An endothermic reaction absorbs heat from the surroundings, so qreaction is positive and the solution usually cools. For example, if a reaction causes the solution to absorb +8.0 kJ, the reaction releases −8.0 kJ and is exothermic. In contrast, if dissolving ammonium nitrate causes the solution to lose 5.0 kJ, the dissolving process gains +5.0 kJ and is endothermic. Temperature change alone describes the surroundings, so its sign must be reversed when assigning the reaction’s heat. Breaking and forming bonds both contribute to the overall enthalpy change; the net energy transfer determines the classification.

Comparing Fuel Energy Tradeoffs
Fuel choices should be compared using both energy benefits and economic or environmental costs. Energy density, often reported in megajoules per kilogram, indicates how much energy a fuel can provide per unit mass. Gasoline releases about 46 MJ/kg, while hydrogen releases about 120 MJ/kg by mass, but hydrogen requires bulky tanks or high-pressure storage because its density is low. A marginal analysis asks whether the benefit of one additional unit of fuel or infrastructure exceeds its additional cost. For example, replacing one gasoline bus with a hydrogen bus may reduce tailpipe carbon dioxide, but the decision also depends on vehicle price, fueling stations, hydrogen production method, storage, and energy efficiency. A strong argument uses a common functional unit, such as cost and emissions per kilometer traveled, and distinguishes calorimetry measurements from broader life-cycle impacts. No single fuel is best under every condition.
