
Modeling Internet Packet Routing and Fault Tolerance
Students model how packets travel through a network, compare routes using latency and reliability, and explain how redundant paths keep internet communication functioning when a connection fails.
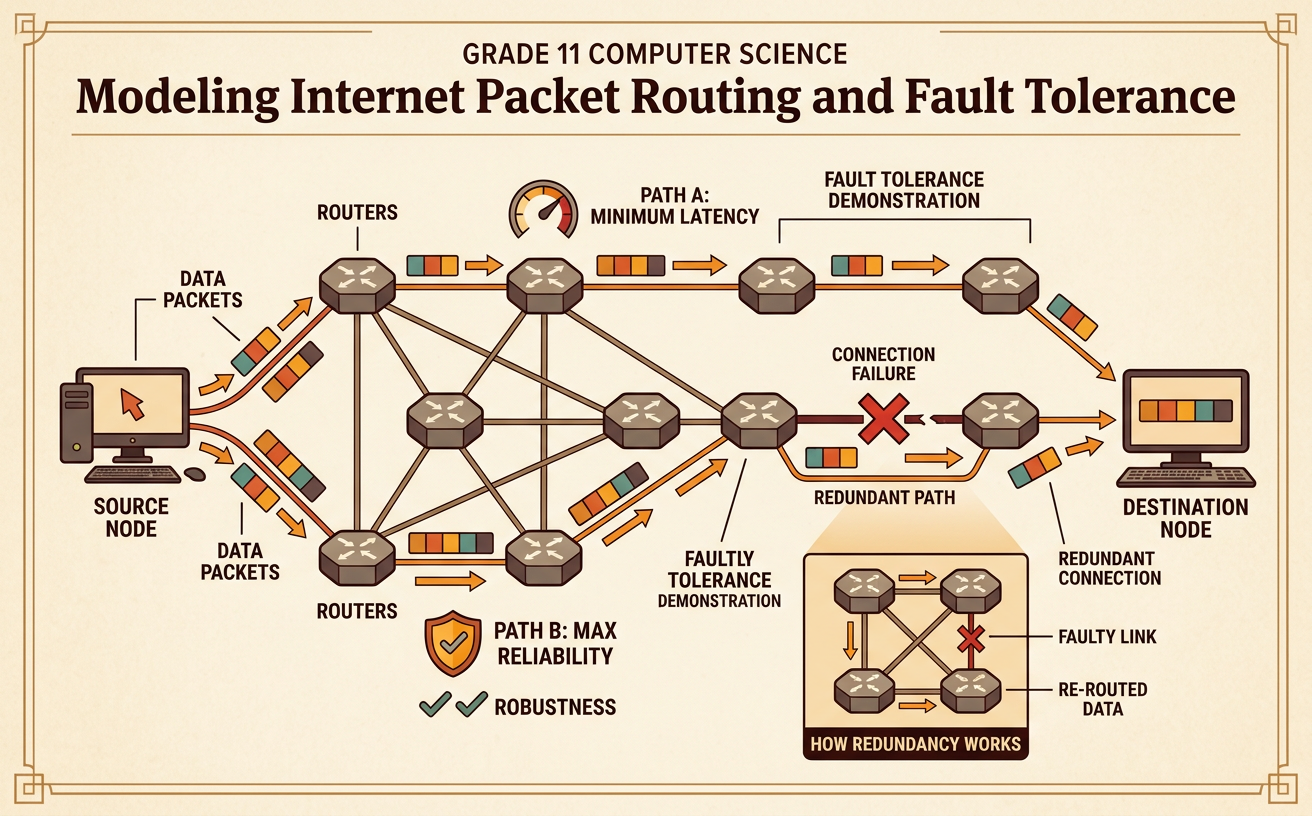
Illustrations are auto-generated and may be placeholders. They can be refreshed to match the narration.
Packets, Nodes, and Links
Internet messages are divided into smaller units called packets. Each packet contains part of the data plus control information, such as source and destination addresses. A node is a device that sends, receives, or forwards packets. Computers and servers are endpoint nodes, while routers are intermediate nodes. A link is a wired or wireless connection between two nodes. For example, when Maya sends a photo to a school server, her laptop creates packets that travel to a home router, through several internet routers, and finally to the server. The packets may take different routes and arrive at slightly different times. The receiving server uses packet information to put the data in the correct order. This packet-based design allows many users to share network links efficiently instead of reserving one continuous connection for each message.

Mapping a Network as a Graph
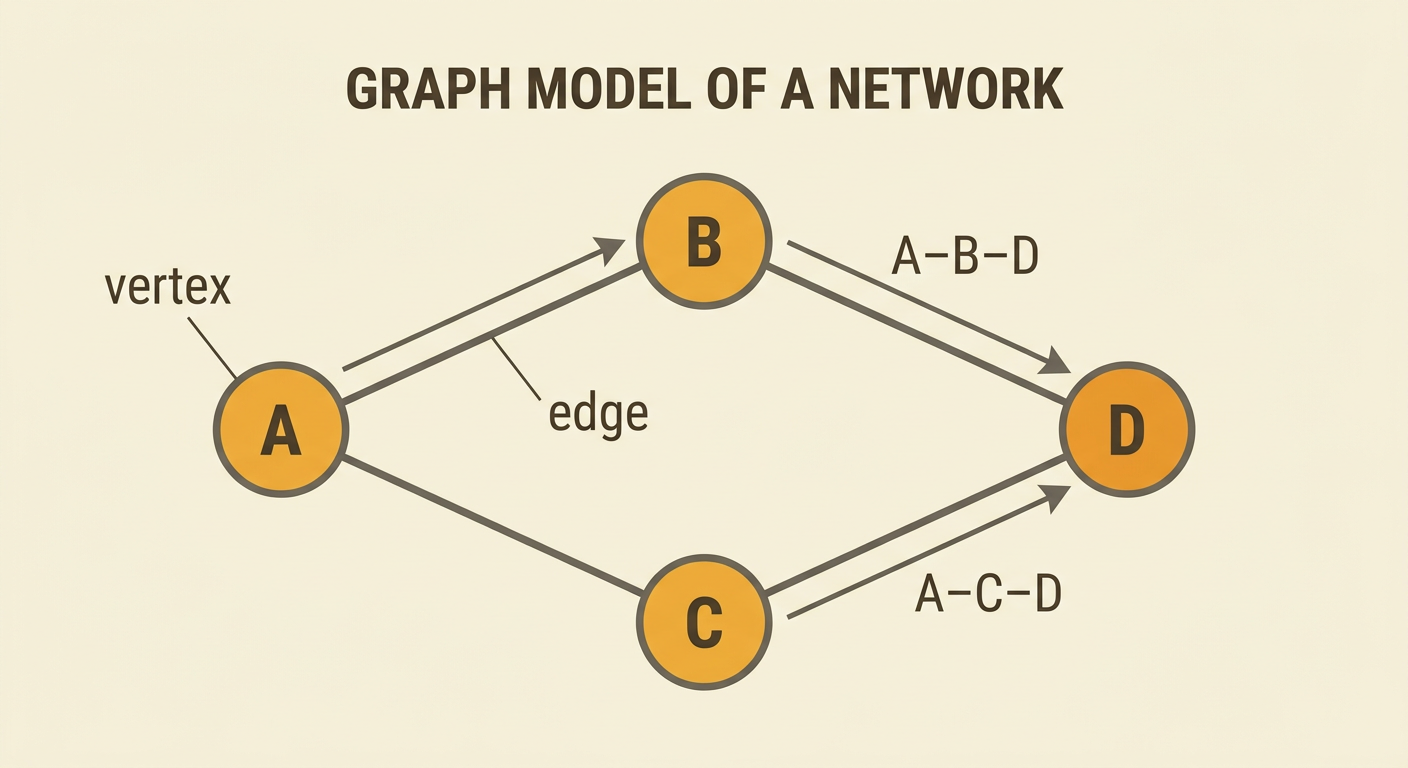
A network can be modeled as a graph, a mathematical structure made of vertices and edges. In this model, each vertex represents a node, and each edge represents a link. Suppose routers A, B, C, and D are connected by the links A–B, A–C, B–D, and C–D. A packet traveling from A to D could follow A–B–D or A–C–D. Drawing the network as a graph makes possible routes easier to identify and compare. Values can also be attached to edges to represent measurements such as latency, bandwidth, cost, or reliability. The graph is a simplified model: it leaves out many physical details while preserving information needed to study routing. Engineers use larger and more dynamic versions of such models to analyze real networks, although actual routing decisions are made by protocols and router configurations.
Comparing Latency and Hop Count
Hop count is the number of links a packet crosses, while latency is the time required for data to travel across those links and be processed. The route with fewer hops is not always faster. Consider two routes from A to D. Route A–B–D has two hops, with link latencies of 18 milliseconds and 22 milliseconds, for a modeled total of 40 milliseconds. Route A–C–E–D has three hops, but its latencies are 8, 9, and 10 milliseconds, totaling 27 milliseconds. If low delay is the priority, the three-hop route is better in this simplified model. However, latency can change because of congestion, distance, equipment, and transmission conditions. Engineers therefore compare measured or estimated values rather than relying only on hop count. The best route also depends on other criteria, including reliability, bandwidth, security, and operating cost.

Simulating a Link Failure
A link failure occurs when a connection becomes unavailable because of damaged cables, equipment problems, power loss, interference, or maintenance. To simulate a failure, begin with the graph containing routes A–B–D and A–C–D. Assume packets normally use A–B–D because its total latency is 20 milliseconds, compared with 30 milliseconds for A–C–D. Now remove or cross out the B–D link. Packets can still travel from A to D by using A–C–D, although the route is slower. Record the route before and after the failure, then compare latency and successful delivery. If no alternate path existed, the packets would not reach D until the failed connection was restored. This simulation shows why evaluating a network requires more than measuring performance under normal conditions. A strong design must also be tested under realistic disruptions and constraints.

Redundancy and Fault Tolerance
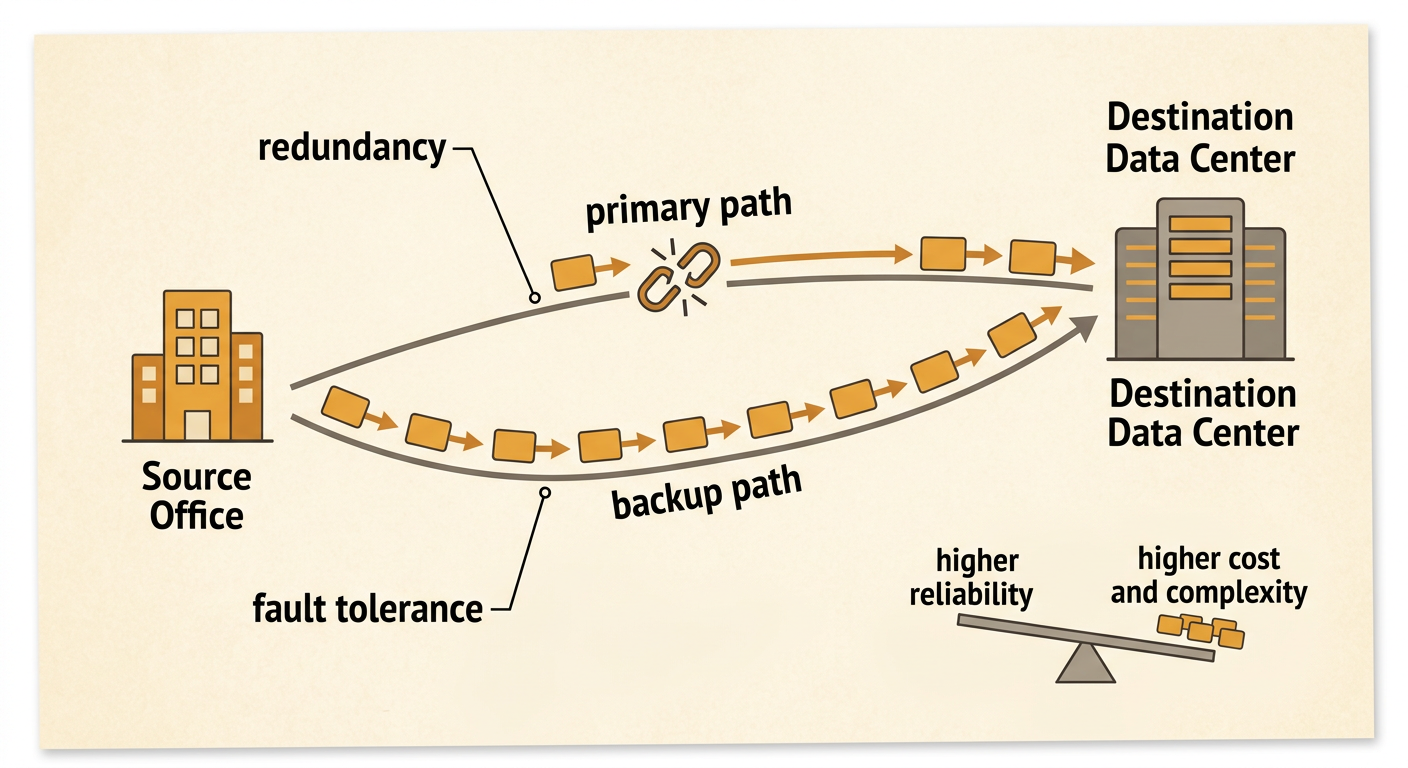
Redundancy means including more than one path, link, or device that can perform a needed function. Fault tolerance is a system’s ability to continue operating when part of it fails. In the example network, two routes between A and D provide path redundancy. If one route breaks, routing systems can direct traffic to the other route. This continued service demonstrates fault tolerance, though users may notice increased delay or reduced capacity. Redundancy has trade-offs: extra cables, routers, maintenance, electricity, and monitoring increase cost and complexity. However, the benefit can be essential for hospitals, emergency services, banks, schools, and international businesses that depend on continuous communication. Redundant global networks also support economic interdependence by allowing orders, payments, and information to cross long distances even during disruptions. Designers must balance reliability against cost, performance, security, and physical constraints.
Explaining the Best Route
The best route depends on prioritized criteria, so a conclusion should use evidence rather than simply name the shortest path. Suppose Route 1 has a latency of 24 milliseconds, two hops, and 92 percent reliability, while Route 2 has a latency of 30 milliseconds, three hops, and 99.9 percent reliability. For an online game, where immediate response is highly important, Route 1 might be preferred if its lower reliability is acceptable. For a bank transaction or emergency message, Route 2 may be better because successful delivery is the higher priority. A strong explanation identifies the chosen route, cites numerical evidence, addresses trade-offs, and states relevant constraints. It should also integrate the graph, a data table, and the failure simulation. For example: Route 2 is best for critical communication because its 99.9 percent reliability outweighs its 6-millisecond latency disadvantage, and its redundant connections maintain service during the tested failure.
