Modeling Periodic Phenomena with Trigonometric Functions
Students construct and interpret sine and cosine models for periodic real-world situations using amplitude, period, midline, and phase shift.
Illustrations are auto-generated and may be placeholders. They can be refreshed to match the narration.
Recognizing Periodic Patterns
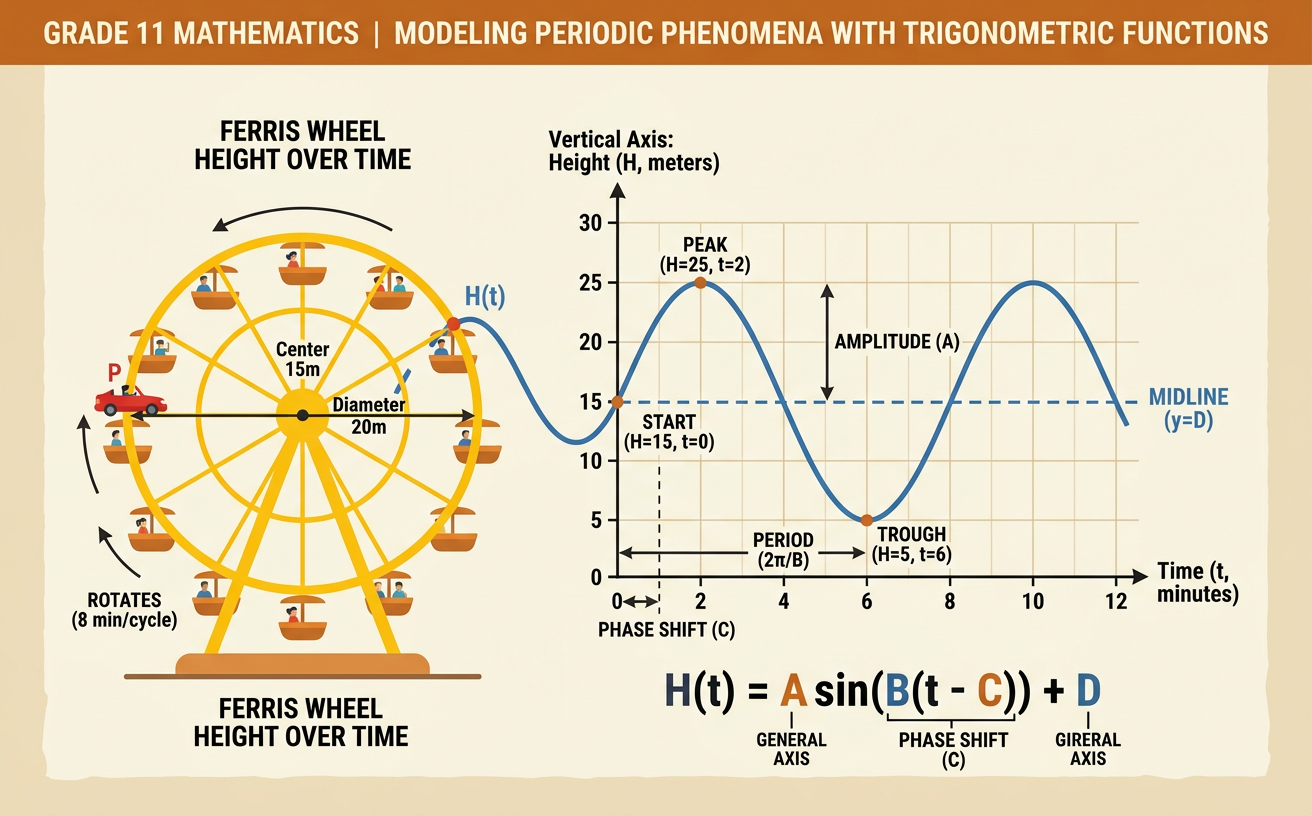
A periodic pattern repeats its values over equal intervals of the input. In a real-world model, the input is often time, while the output may be height, temperature, distance, or another changing quantity. For example, a Ferris wheel completes one revolution every 40 seconds. A rider reaches a maximum height of 34 feet at 0, 40, and 80 seconds and a minimum height of 6 feet at 20 and 60 seconds. Because the same sequence of heights repeats every 40 seconds, the rider’s height is periodic. A smooth, wave-shaped graph suggests that a sine or cosine function may be appropriate. However, repetition alone is not enough: the cycles should have approximately the same length, center value, and vertical range.

Identifying Amplitude and Midline
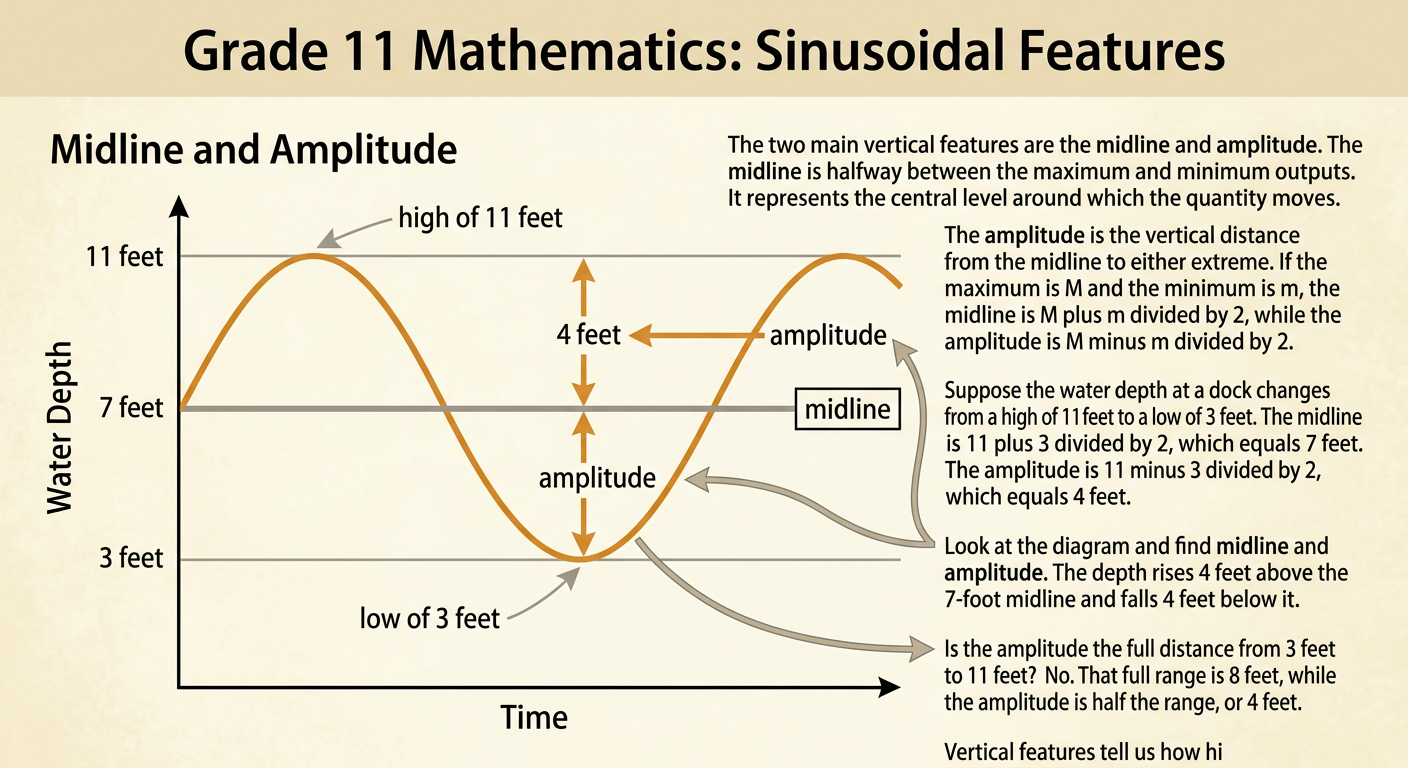
The midline is the value halfway between the maximum and minimum outputs. It represents the central or average level around which a periodic quantity oscillates. The amplitude is the vertical distance from the midline to either extreme. If M is the maximum and m is the minimum, then the midline is (M + m)/2 and the amplitude is (M − m)/2. Suppose the water depth at a dock varies from a high of 11 feet to a low of 3 feet. The midline is (11 + 3)/2 = 7 feet, and the amplitude is (11 − 3)/2 = 4 feet. Thus, the depth rises 4 feet above and falls 4 feet below its 7-foot midline.
Determining Period and Frequency
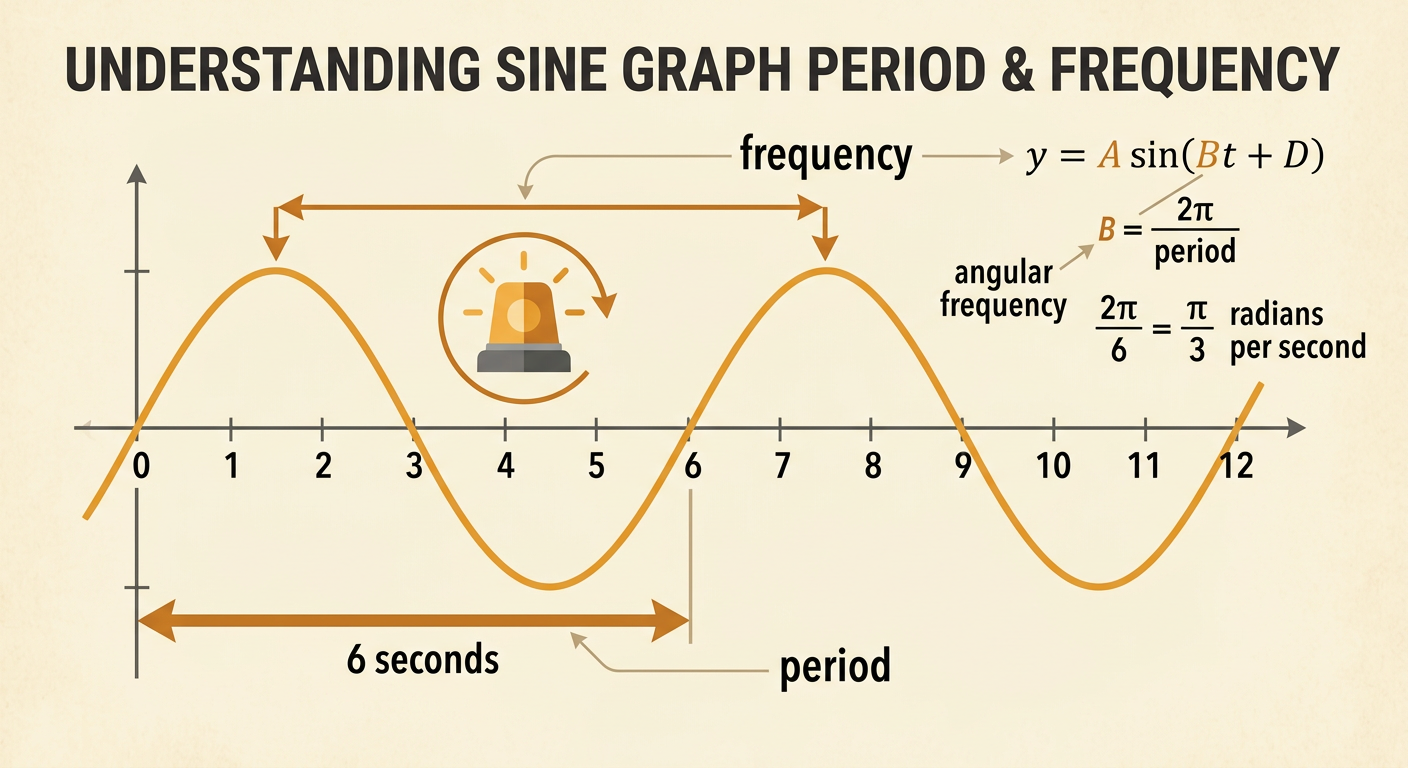
The period is the horizontal length of one complete cycle. It can be measured between consecutive maxima, consecutive minima, or matching midline crossings moving in the same direction. Frequency tells how many cycles occur per unit of input and equals 1 divided by the period. For example, a rotating beacon completes one cycle every 6 seconds, so its period is 6 seconds and its frequency is 1/6 cycle per second. In a model such as y = A sin(Bt) + D, the coefficient B is angular frequency, measured in radians per unit. Because one cycle contains 2π radians, B = 2π/P. For the beacon, B = 2π/6 = π/3 radians per second. Ordinary frequency and angular frequency are related but are not the same quantity.
Building a Sine or Cosine Model
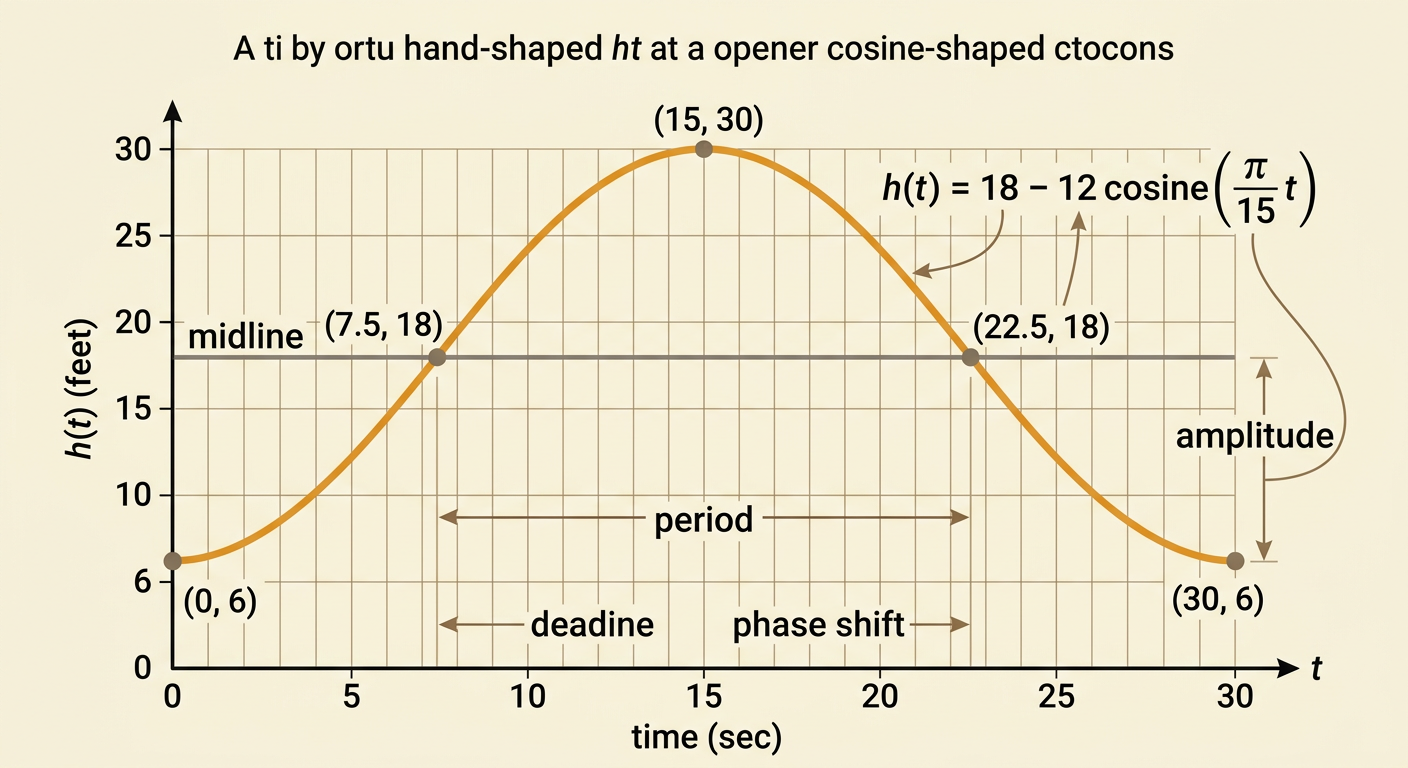
A useful model is y = D + A cos(B(t − C)) or y = D + A sin(B(t − C)). Here, |A| is the amplitude, D is the midline, B = 2π/P determines the period P, and C is the phase shift. Choose cosine when a cycle begins conveniently at a maximum or minimum; choose sine when it begins at a midline crossing. Suppose a Ferris wheel has a midline height of 18 feet, an amplitude of 12 feet, and a 30-second period. A rider starts at the lowest point. Since B = 2π/30 = π/15, one model is h(t) = 18 − 12 cos((π/15)t). The negative cosine starts at the minimum: h(0) = 6 feet. At 15 seconds, the rider reaches h(15) = 30 feet, the maximum.
Interpreting and Checking the Model
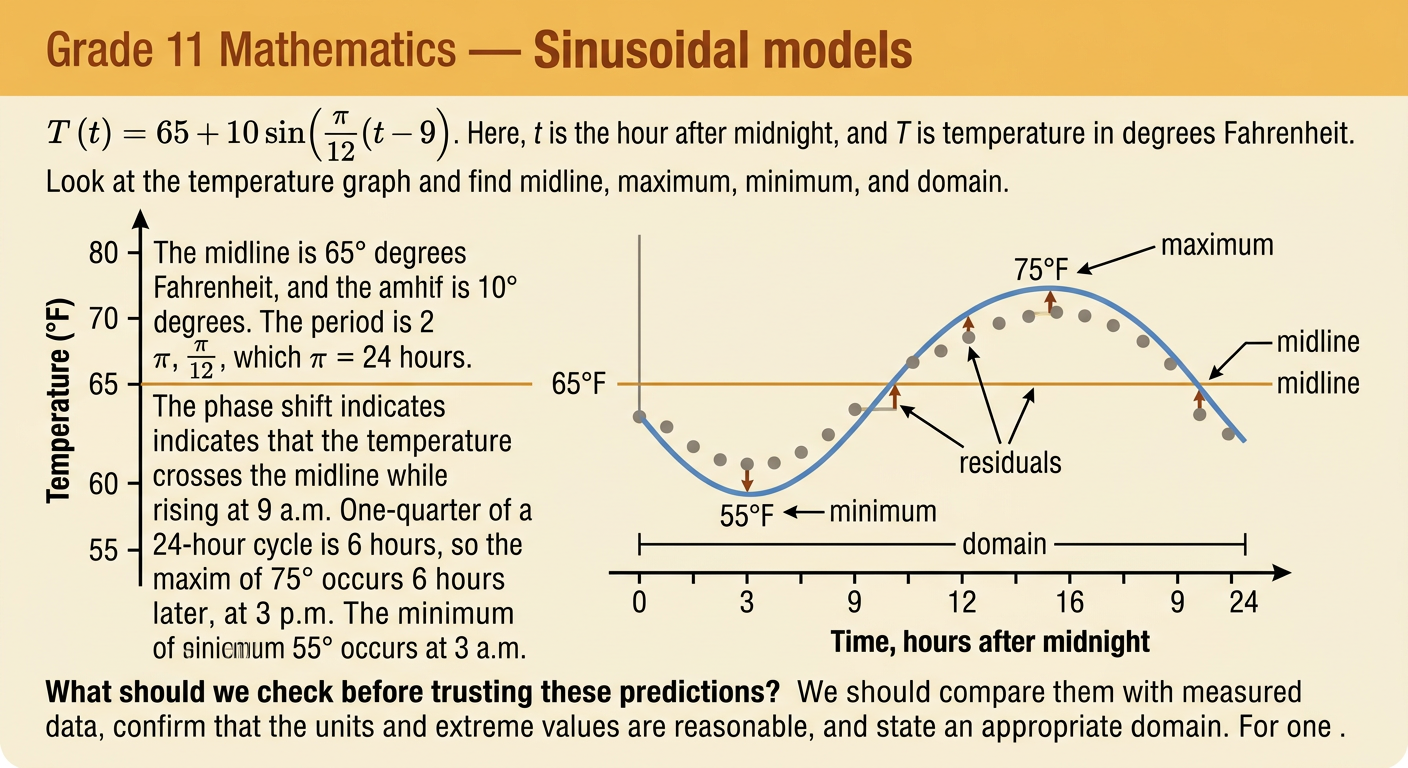
After building a model, interpret each parameter in context and test whether the predicted values are reasonable. Consider T(t) = 65 + 10 sin((π/12)(t − 9)), where t is the hour after midnight and T is temperature in degrees Fahrenheit. The midline is 65°F, the amplitude is 10°F, and the period is 2π divided by π/12, or 24 hours. The phase shift shows that the temperature crosses 65°F while rising at 9 a.m. The model predicts a maximum of 75°F at 3 p.m. and a minimum of 55°F at 3 a.m. Check these predictions against measured data, confirm that units and extreme values make sense, and state an appropriate domain, such as 0 ≤ t ≤ 24. Differences between observations and predictions are residuals and may reveal limitations in the model.