
Modeling Sound Waves: Amplitude, Frequency, and Energy
Students interpret and create wave models to explain how amplitude relates to sound energy, frequency relates to pitch, and sound evidence can inform community noise rules.
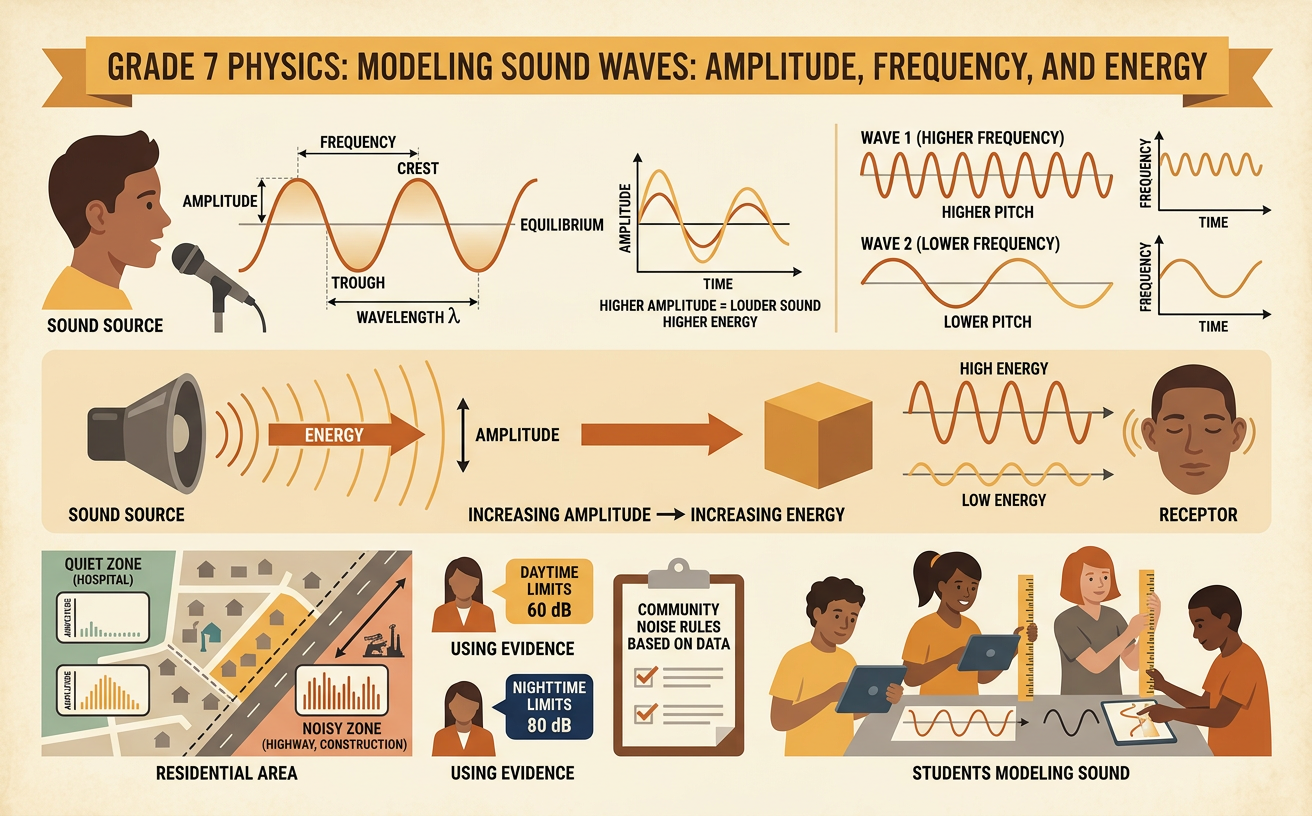
Illustrations are auto-generated and may be placeholders. They can be refreshed to match the narration.
What Makes a Sound Wave?
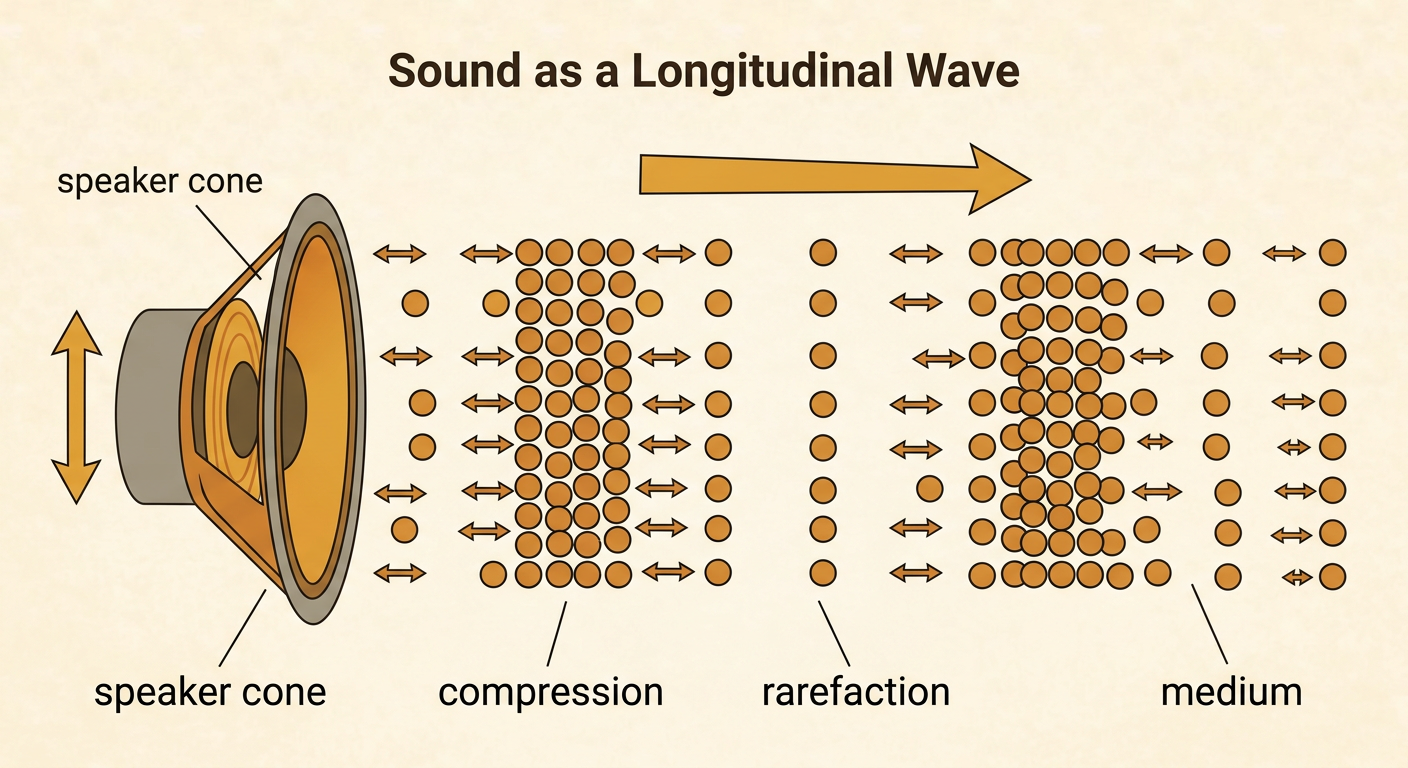
Sound begins when an object vibrates. A vibrating speaker cone, for example, pushes nearby air molecules closer together and then moves back, leaving them farther apart. These alternating compressions and rarefactions travel outward through the air as a longitudinal wave. The air molecules vibrate back and forth near their usual positions; they do not travel all the way from the speaker to the listener. Energy is transferred through the material as the disturbance moves. Sound therefore needs a medium, such as air, water, or a solid. It cannot travel through an empty vacuum. Although sound in air is longitudinal, scientists often draw it as a curved wave because that model makes measurements such as amplitude and frequency easier to see and compare.
Reading Wave Models
A wave graph is a model, not a picture of air molecules following a curved path. On a displacement-versus-time graph, the horizontal axis shows time and the vertical axis shows how far a vibrating particle or object is from its equilibrium position. The equilibrium line represents the resting position. Amplitude is the greatest distance from equilibrium to a crest or trough. One cycle is one complete repeating pattern, such as from one crest to the next crest. For example, if a graph shows three complete cycles between 0 and 1 second, its frequency is 3 hertz. Wave models must use equal axis scales when students compare shapes. A taller-looking wave does not necessarily have a greater measured amplitude if its graph uses a different vertical scale.

Amplitude, Energy, and Loudness
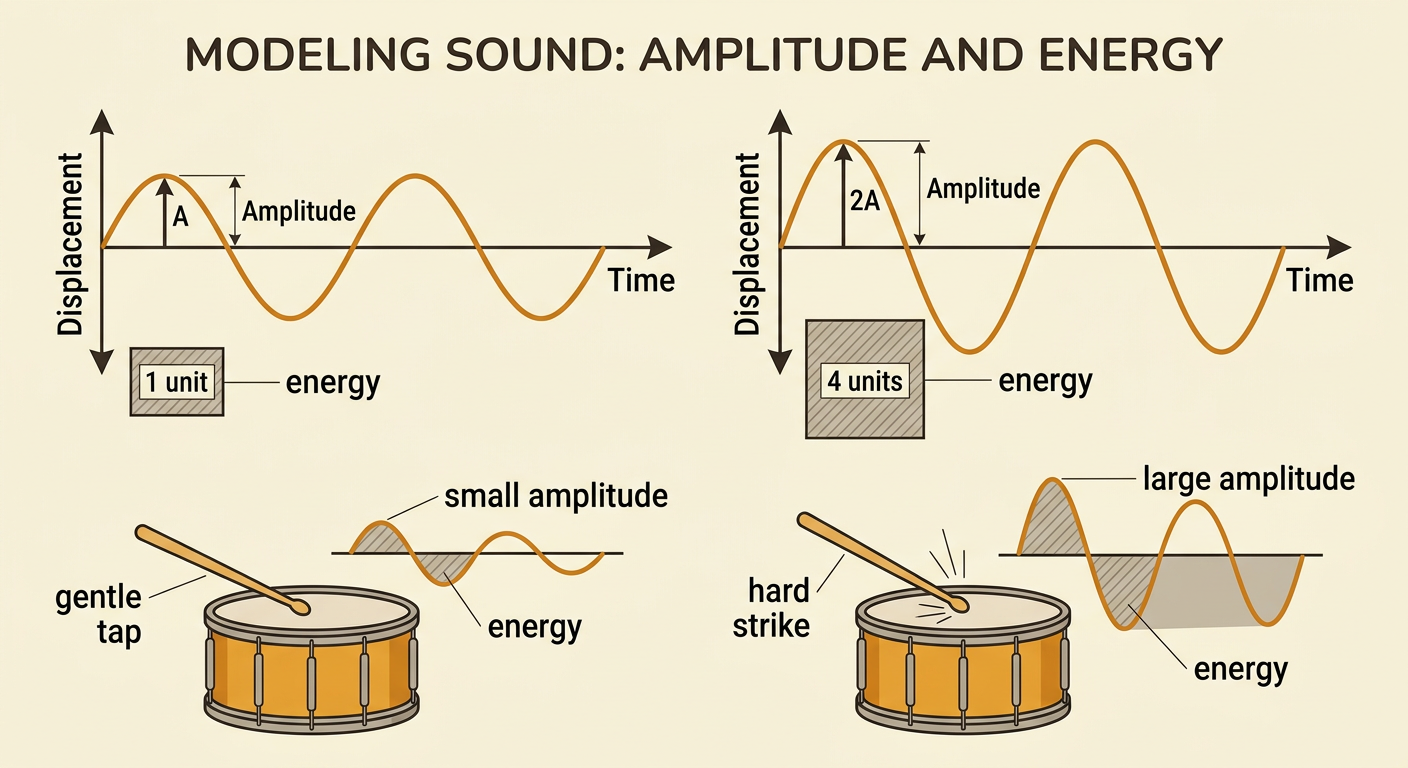
Amplitude measures the maximum size of a vibration from its equilibrium position. A sound wave with greater amplitude transfers more energy through the same medium than a similar wave with smaller amplitude. In a simple wave model, energy is proportional to the square of amplitude. This can be written as E is proportional to A squared. If amplitude doubles, the modeled energy becomes four times as great because 2 squared equals 4. If amplitude triples, the energy becomes nine times as great. For example, striking a drum harder produces larger vibrations and sends out more sound energy than tapping it gently. We usually perceive the higher-amplitude sound as louder, but loudness is also affected by distance, surroundings, frequency, and human hearing. Amplitude and loudness are related, but they are not identical measurements.
Frequency and Pitch
Frequency is the number of complete wave cycles that pass a point each second. Its unit is the hertz, abbreviated Hz; one hertz means one cycle per second. Frequency is closely related to pitch, the perception of how high or low a sound seems. A faster vibration produces more cycles each second and usually a higher pitch. A slower vibration produces fewer cycles and usually a lower pitch. For example, a guitar’s thin string can vibrate at 440 Hz, while a thicker string may vibrate at 220 Hz. The 440 Hz string completes twice as many cycles each second and sounds higher. Changing frequency does not automatically change amplitude. Two notes can have different pitches but equal amplitudes, or the same pitch but different amplitudes. Pitch and loudness describe different features of sound.

Comparing Wave Measurements
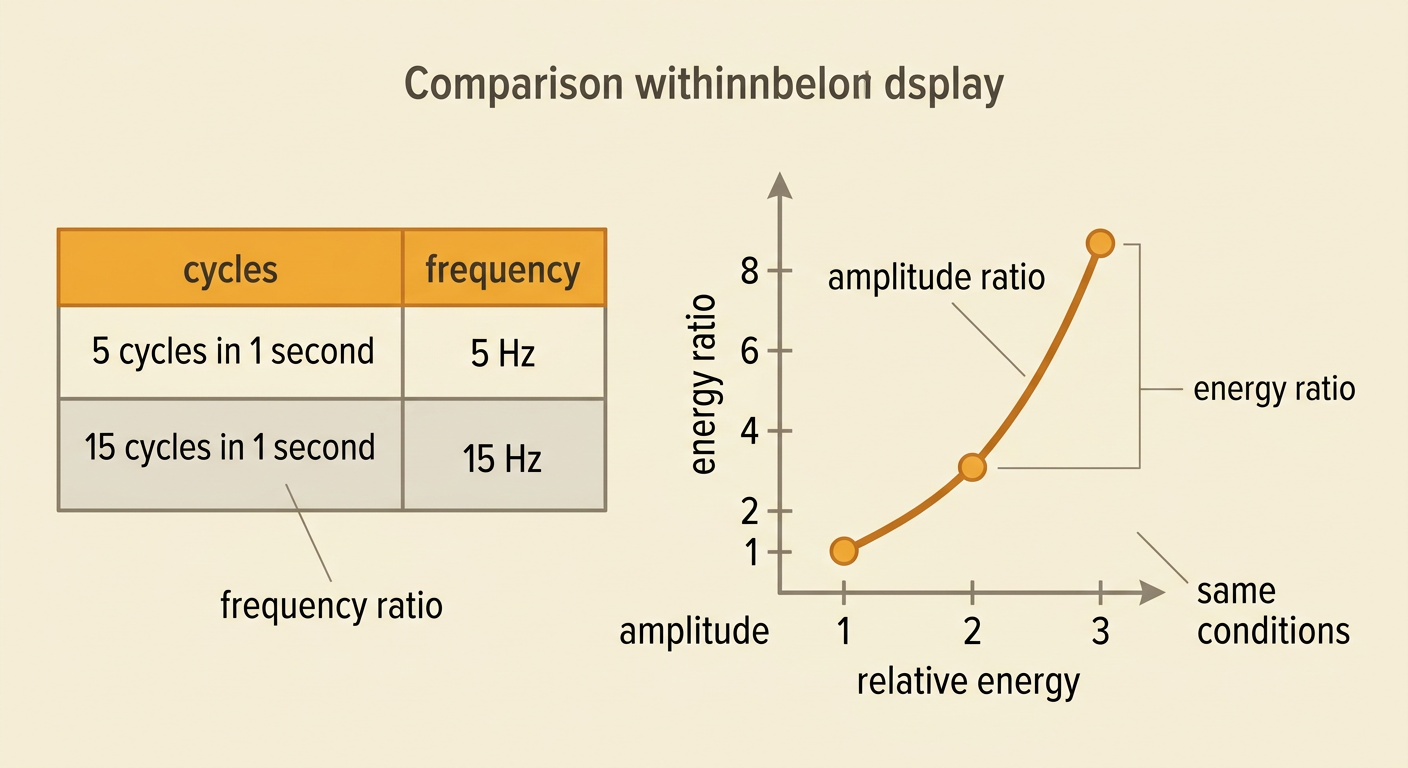
Wave measurements can be organized in tables, graphs, equations, and ratios. Frequency has a proportional relationship with the number of cycles when the time interval stays fixed. If one sound makes 5 cycles in 1 second and another makes 15 cycles in 1 second, the second frequency is three times the first: 15 divided by 5 equals 3. Amplitude and energy follow a different pattern in the simple model E equals k times A squared, where k stays constant for waves compared under the same conditions. If two amplitudes have a ratio of 3 to 1, their energies have a ratio of 9 to 1. Students should compare waves using measured values, units, and identical conditions. They should not claim a proportional relationship simply because both quantities increase; they must check whether the ratio or the relevant mathematical rule remains consistent.
Applying Evidence to Community Noise Rules
Communities create noise rules to protect sleep, learning, health, and public spaces while allowing transportation, construction, celebrations, and emergency services. Sound-level meters commonly report sound level in decibels, abbreviated dB. Because the decibel scale is logarithmic, an increase of 10 dB represents ten times the sound intensity, not a simple increase of ten equal intensity units. Suppose repeated nighttime measurements near homes are 70 dB while a proposed limit is 55 dB. Residents could use the measurements, times, locations, and duration of the sound to evaluate the rule. A strong policy might set different daytime and nighttime limits, identify measurement locations, explain enforcement, and allow narrow emergency exceptions. Students should also consider fairness, costs, and input from residents and businesses. Evidence supports better decisions, but a single reading is not enough to describe an entire community problem.
