
Modeling Wave Properties and Energy
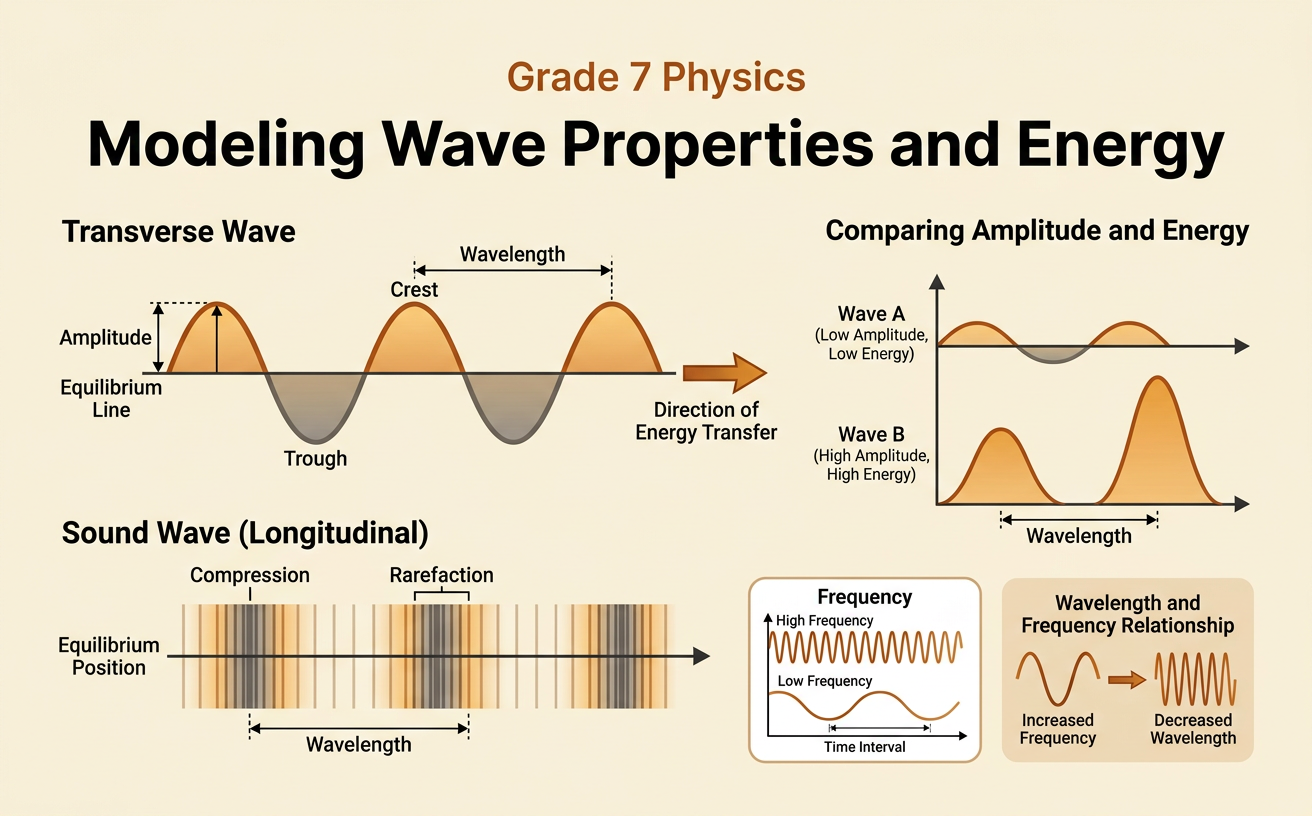
Students use diagrams and simple data to investigate how amplitude, wavelength, and frequency describe waves and how greater amplitude relates to greater wave energy.
Illustrations are auto-generated and may be placeholders. They can be refreshed to match the narration.
What Is a Wave?
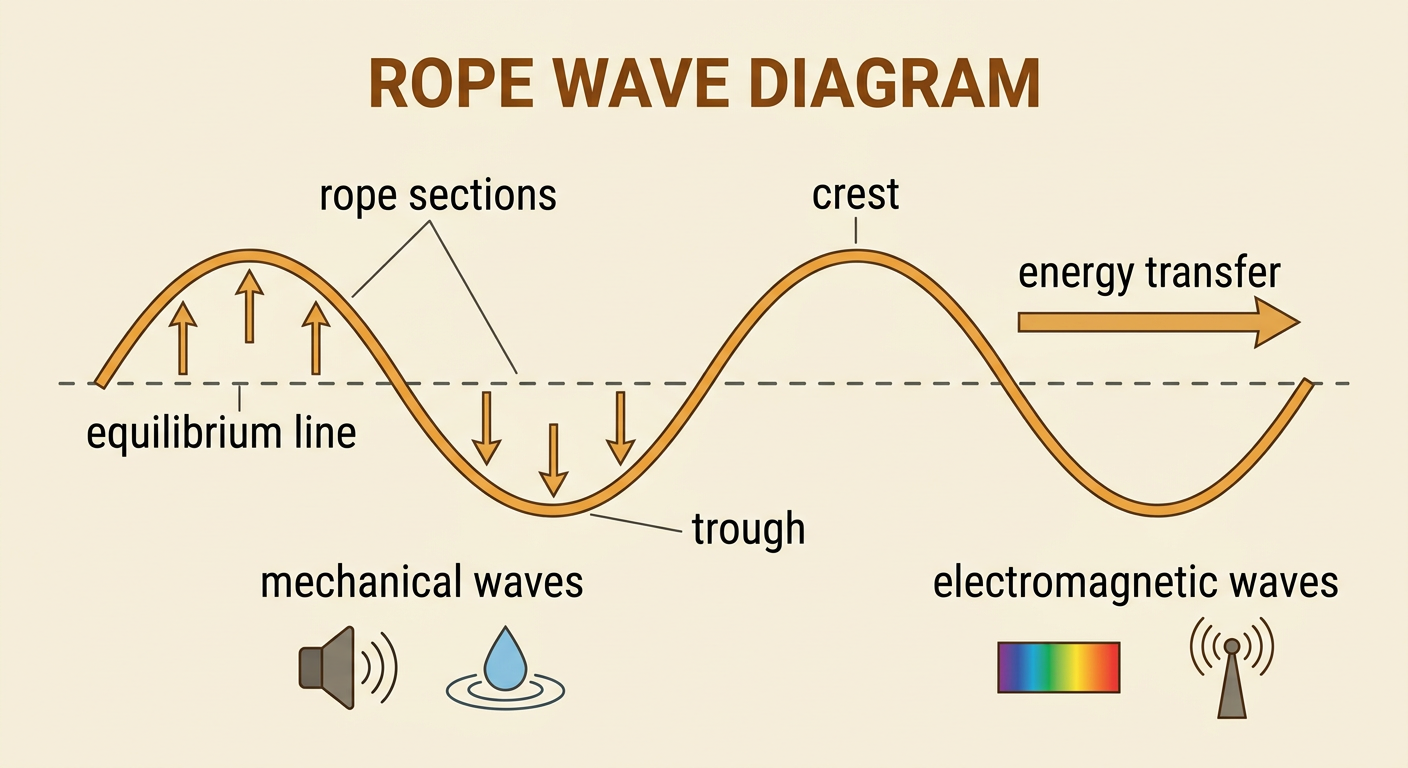
A wave is a repeating or traveling disturbance that transfers energy from one place to another. Matter may move back and forth as the wave passes, but it usually does not travel with the wave over a long distance. For example, when one end of a rope is moved up and down, the rope sections move mainly vertically while the wave travels horizontally. Waves that require matter, such as water waves and sound waves, are mechanical waves. Electromagnetic waves, including visible light and radio waves, can travel through empty space. A simple wave model uses an equilibrium line to show the undisturbed position. Crests rise above this line, and troughs fall below it. These repeating features allow scientists to measure and compare waves.
Identifying Amplitude and Wavelength
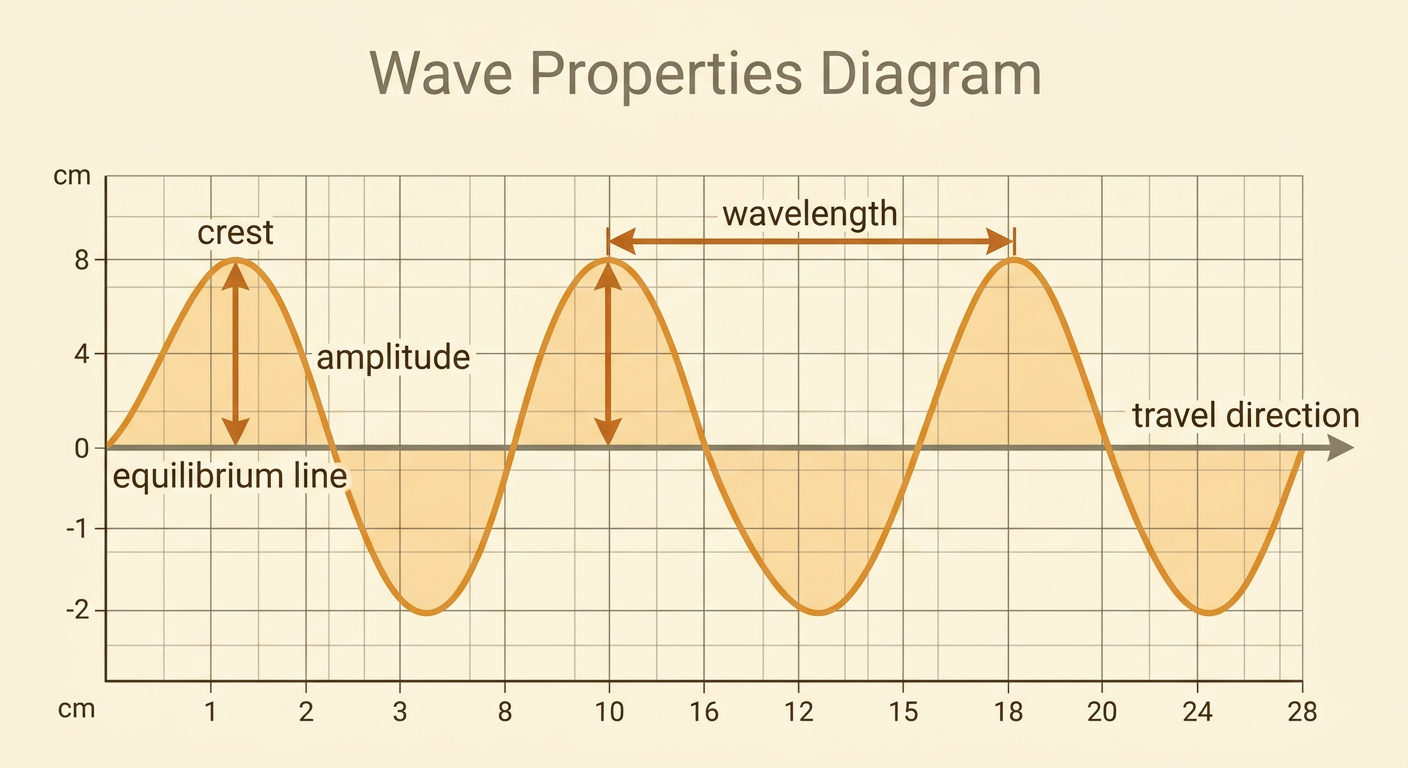
Amplitude and wavelength describe different features of a wave. Amplitude is the maximum distance from the equilibrium line to a crest or to a trough. It is not the entire distance from a crest to a trough. For example, if a crest is 3 centimeters above equilibrium, the wave’s amplitude is 3 centimeters. Wavelength is the distance between the same point on two consecutive cycles, such as crest to crest or trough to trough. If neighboring crests are 8 centimeters apart, the wavelength is 8 centimeters. Amplitude is measured perpendicular to the direction the wave travels, while wavelength is measured parallel to that direction. A scaled diagram lets students use rulers or grid spacing to identify both quantities accurately.
Comparing Frequency
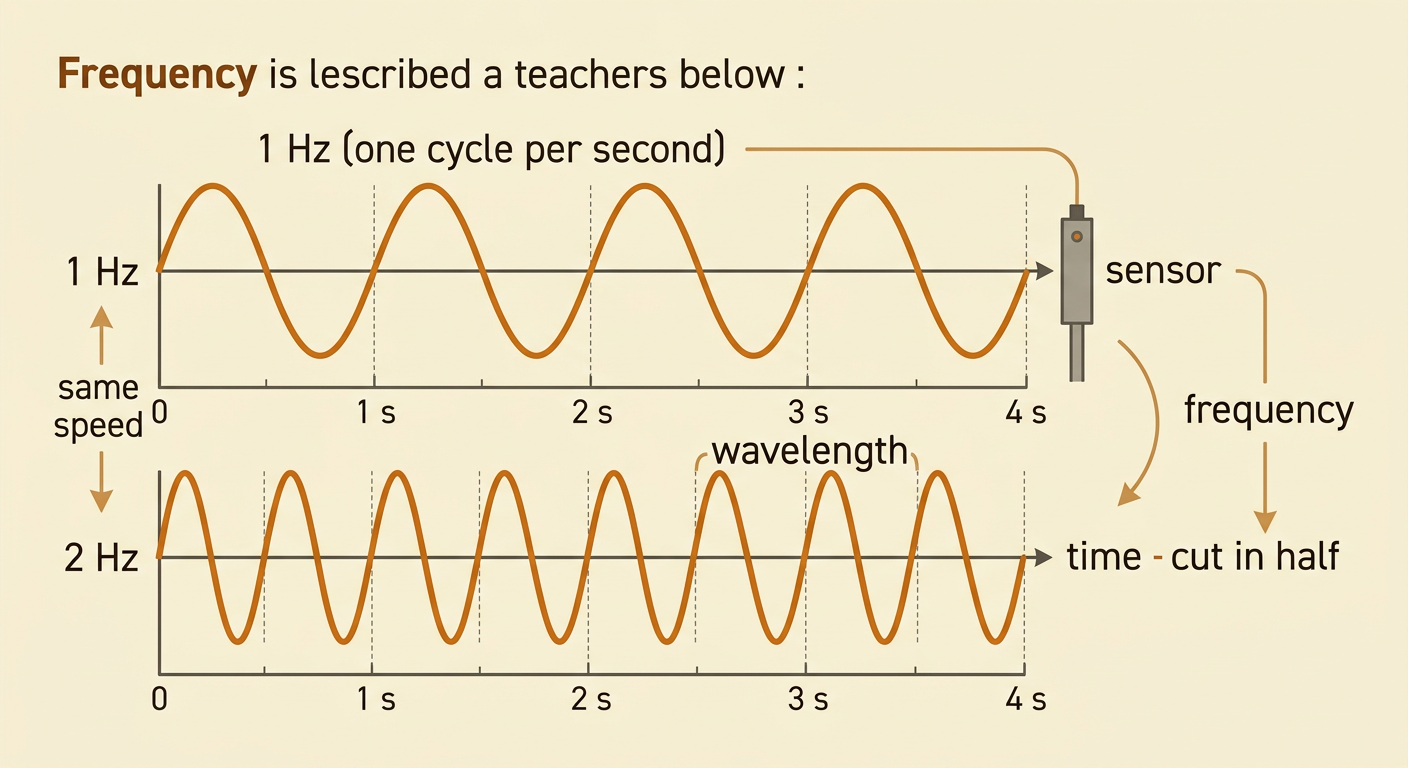
Frequency tells how many complete wave cycles pass a point during a certain amount of time. It is measured in hertz, abbreviated Hz, where 1 Hz means one cycle per second. If 12 crests pass a sensor in 3 seconds, the frequency is 12 divided by 3, or 4 Hz. On a time graph, waves with more cycles in the same time interval have greater frequency. Frequency and wavelength are related through wave speed. When two waves travel at the same speed, a higher-frequency wave has a shorter wavelength, and a lower-frequency wave has a longer wavelength. For example, if wave speed stays constant and frequency doubles, wavelength is cut in half. Frequency describes timing, while wavelength describes spacing.
Amplitude and Wave Energy
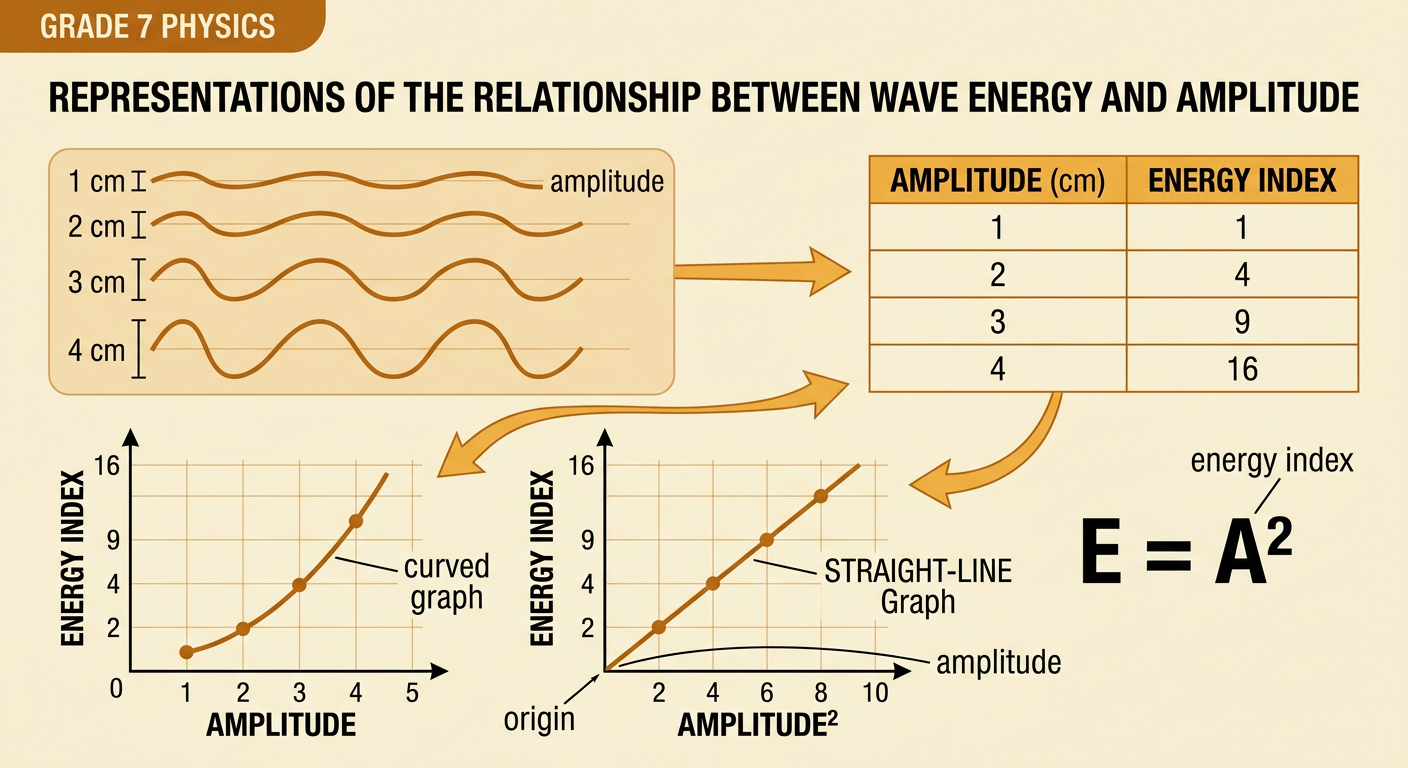
Amplitude is related to the amount of energy carried by a wave. A wave with greater amplitude generally carries more energy than the same kind of wave with a smaller amplitude. In many simple wave models, energy is proportional to the square of amplitude. This means an energy index can be modeled as amplitude squared. A wave with an amplitude of 1 centimeter has an energy index of 1, while a wave with an amplitude of 2 centimeters has an energy index of 4. Doubling amplitude therefore produces four times the energy in this model, not merely twice the energy. A loudly vibrating speaker cone, for example, creates sound waves with greater amplitude and transfers more energy than when it vibrates gently.

Reading and Modeling Wave Data
Tables, graphs, equations, and wave diagrams can represent the same evidence in different ways. Suppose tests produce amplitude values of 1, 2, 3, and 4 centimeters and energy index values of 1, 4, 9, and 16. The pattern is modeled by E = A², where E is the energy index and A is amplitude. Energy is not proportional to amplitude because E divided by A is not constant. However, energy is proportional to amplitude squared because E divided by A² always equals 1 in this data set. A graph of E compared with A curves upward. A graph of E compared with A² forms a straight line through the origin. Students should compare the numbers, the graph, and the wave drawings before making a claim about the relationship.
Waves in Communication Technology
Communication technologies use waves to carry information between people and places. Radio towers send electromagnetic waves through the air, satellites relay microwave signals across long distances, and fiber-optic cables guide pulses of light. Information can be encoded by changing features of a wave, such as its amplitude, frequency, or timing. For example, a cell phone converts sound and digital data into signals that travel between the phone and nearby towers. Networks of towers, cables, and satellites allow messages, news, music, and cultural ideas to spread rapidly among settlements. Mountain ranges, oceans, distance, and access to infrastructure can still affect connections. As transportation and communication technologies improve, communities can exchange ideas without people or physical objects making every part of the journey, changing how settlements interact and how cultural practices diffuse.
