Modeling Wave Properties and Energy
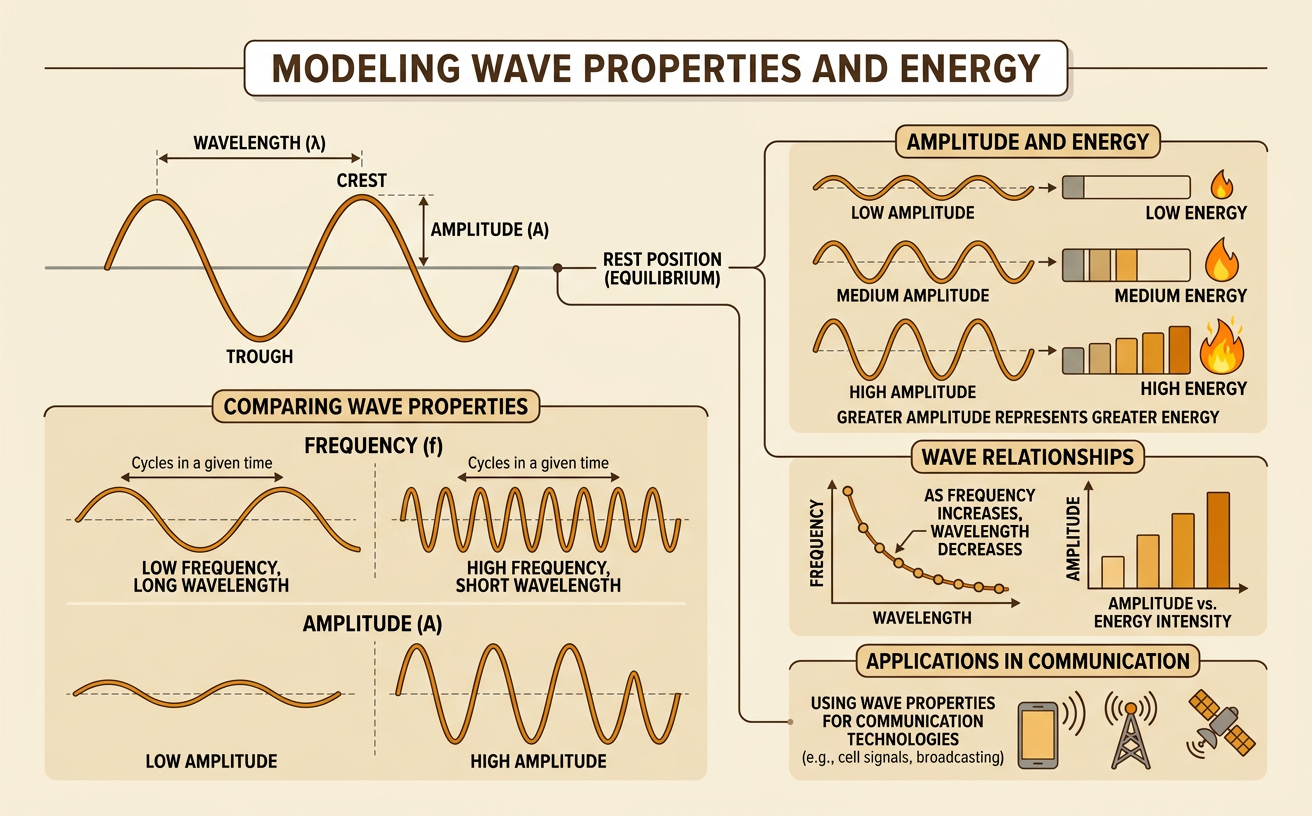
Students use diagrams, data, and graphs to explain wavelength, frequency, and amplitude, including how greater wave amplitude represents greater energy and influences communication technologies.
Illustrations are auto-generated and may be placeholders. They can be refreshed to match the narration.
Parts of a Wave
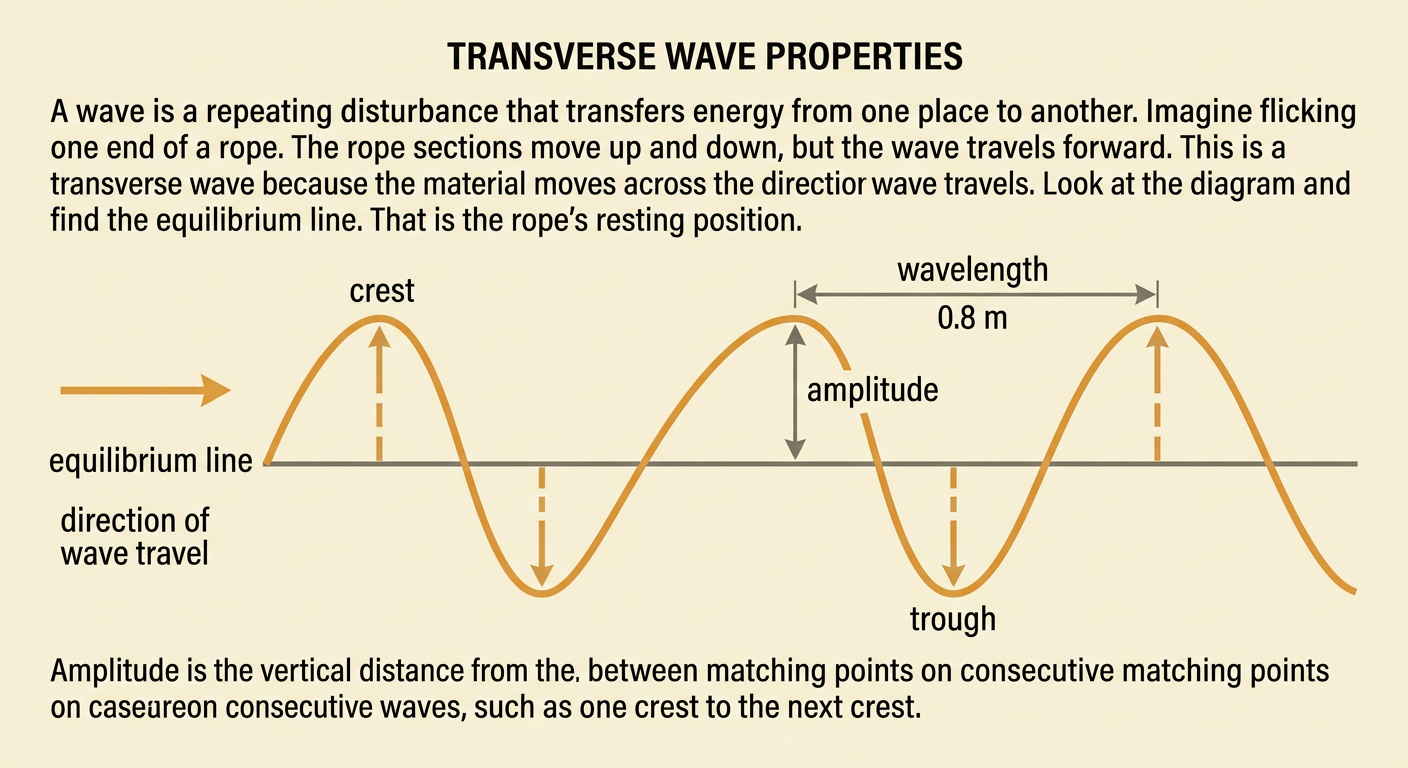
A wave is a repeating disturbance that transfers energy from one place to another. In a transverse wave, such as a wave traveling along a rope, the material moves up and down while the wave travels forward. The equilibrium line shows the material’s resting position. A crest is the highest point, and a trough is the lowest point. Amplitude is the distance from the equilibrium line to a crest or trough. Wavelength is the distance between matching points on consecutive waves, such as crest to crest. For example, if neighboring crests on a rope are 0.8 meter apart, the wavelength is 0.8 meter. The rope itself does not travel 0.8 meter forward; its sections move around their resting positions as energy passes along the rope.
Amplitude and Wave Energy
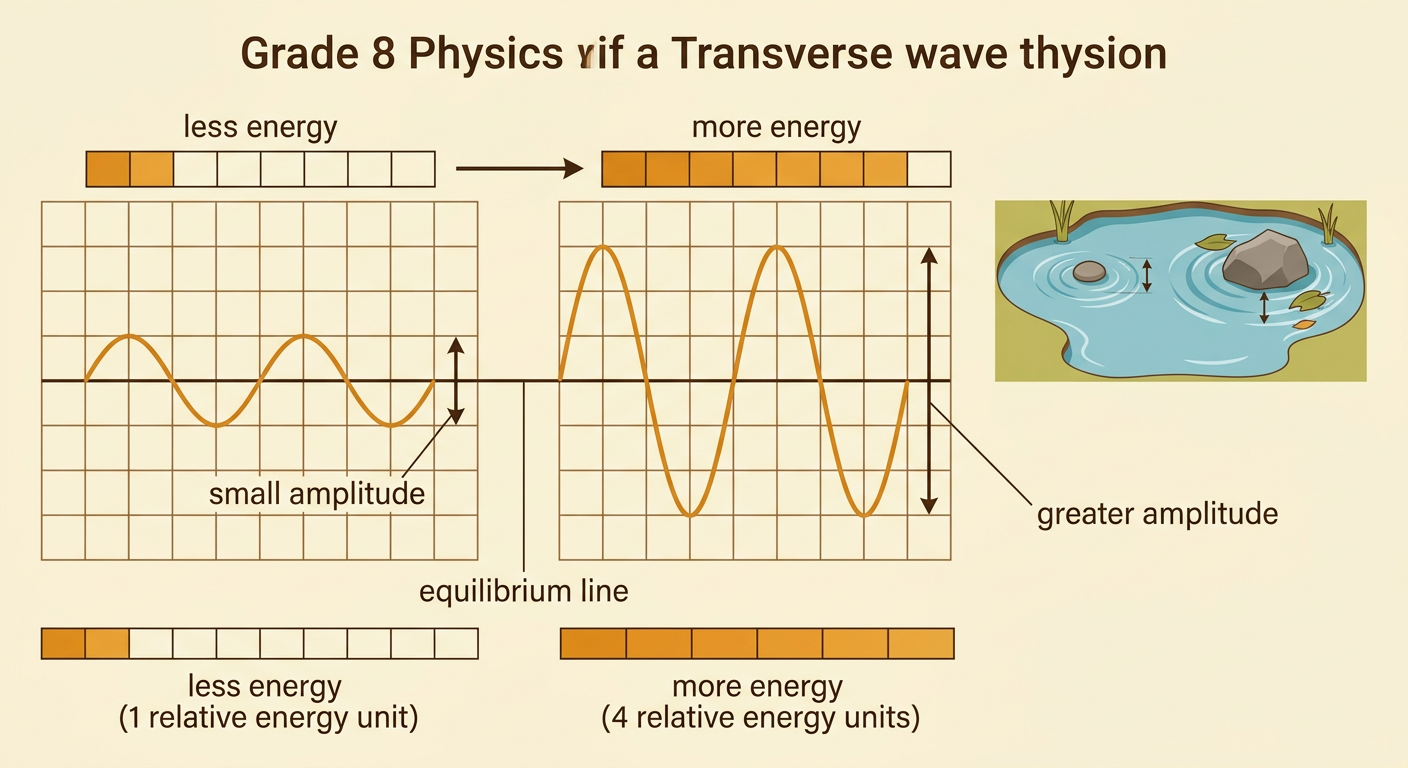
Amplitude measures the maximum displacement from equilibrium. Under the same conditions, a wave with greater amplitude carries more energy than a wave with smaller amplitude. For many mechanical waves, energy is proportional to the square of amplitude. This means that doubling the amplitude can represent about four times as much energy, not merely twice as much. Imagine dropping a small pebble and then a larger rock into the same pond. The larger rock usually produces water waves with greater amplitude, and those waves can move floating leaves more strongly. Amplitude must be measured from the equilibrium line, not from crest to trough. The total distance from a crest to a trough equals two amplitudes. When comparing wave energy using amplitude, keep other factors, such as the medium and frequency, the same.
Wavelength and Frequency
Frequency is the number of complete wave cycles that pass a point each second. It is measured in hertz, where one hertz means one cycle per second. Wavelength is the distance covered by one complete cycle. Wave speed equals frequency multiplied by wavelength. Therefore, when waves travel at the same speed in the same medium, frequency and wavelength have an inverse relationship: as frequency increases, wavelength decreases. For example, a wave moving at 12 meters per second with a frequency of 3 hertz has a wavelength of 4 meters. If the frequency increases to 6 hertz while the speed stays 12 meters per second, the wavelength decreases to 2 meters. A faster vibration at the source produces more cycles each second, but it does not automatically increase amplitude or energy.

Reading and Sketching Wave Graphs
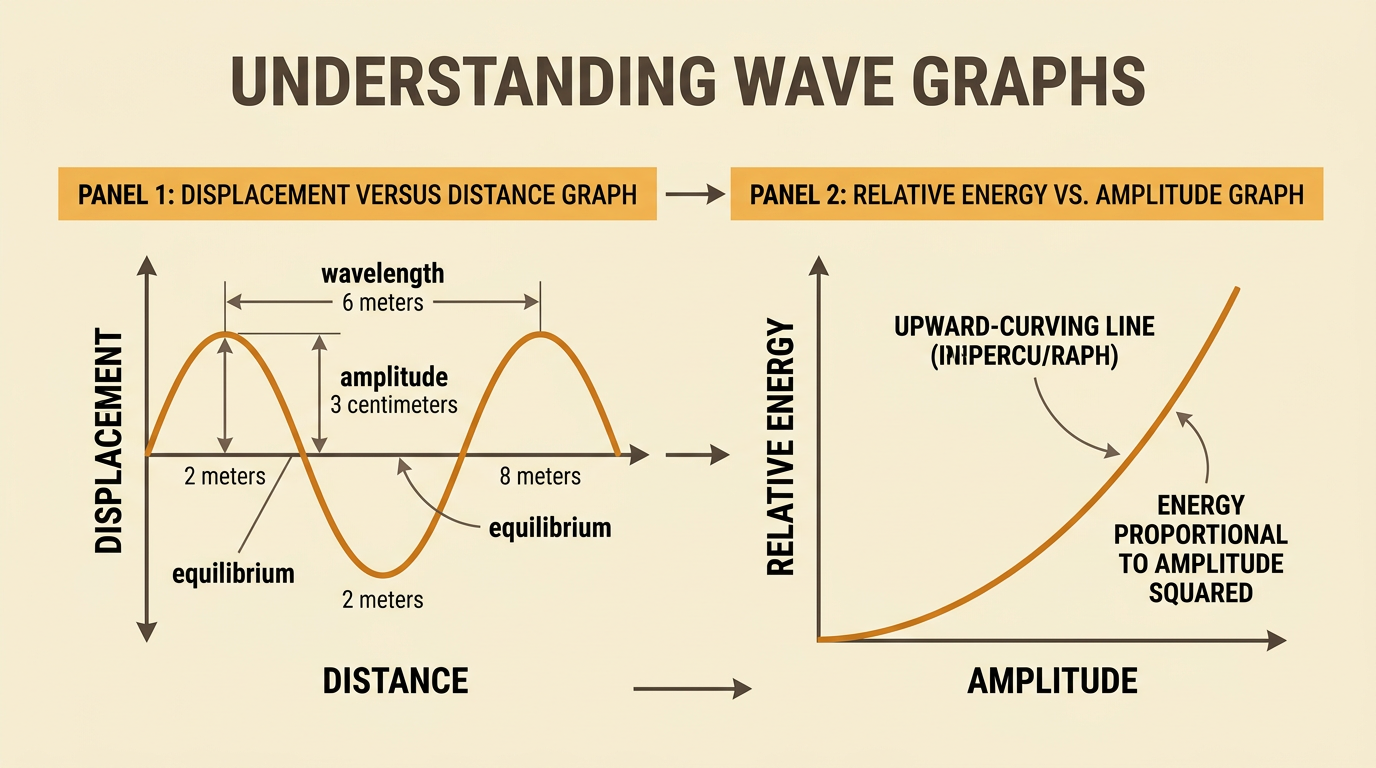
A wave graph can show displacement versus distance at one moment or displacement versus time at one location. Always read the axis labels before interpreting the graph. On a displacement-versus-distance graph, find amplitude by measuring vertically from zero to a crest. Find wavelength by measuring horizontally between consecutive crests. For example, suppose crests occur at 2 meters and 8 meters, and each crest is 3 centimeters above equilibrium. The wavelength is 6 meters, and the amplitude is 3 centimeters. To sketch a wave with greater amplitude but the same wavelength, draw taller crests and deeper troughs without changing their horizontal spacing. A graph of energy versus amplitude curves upward because energy often increases with amplitude squared. Such a graph describes a qualitative relationship: energy rises slowly at first and then more rapidly as amplitude grows.
Waves in Communication Technologies
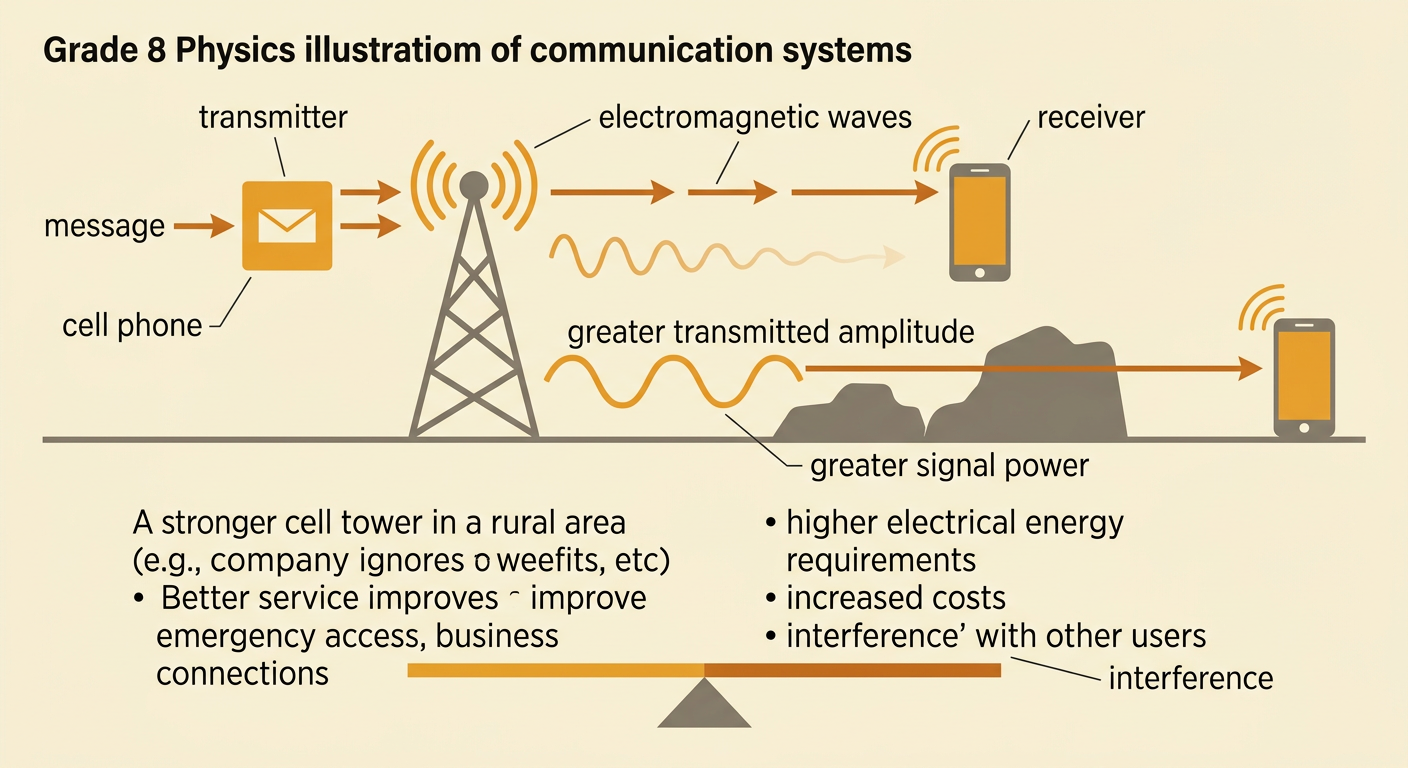
Communication technologies use waves to carry information. Radio towers, cell phones, satellites, and Wi-Fi routers send electromagnetic waves that can be changed to encode sounds, images, or data. A system may vary a wave’s amplitude, frequency, or digital pattern. Greater transmitted amplitude generally means greater signal power, which can help a receiver detect a signal over longer distances or through obstacles. However, higher power requires more electrical energy, costs more, and may increase interference with other users. For example, a company deciding whether to build a stronger cell tower in a rural area must compare construction and energy costs with benefits such as better emergency access and business connections. Government rules may limit frequencies and power to protect users and share resources fairly. Technology decisions therefore affect individuals, businesses, communities, and the environment.