Modeling Wave Properties
Students use diagrams, equations, and simple data to explain how wavelength, frequency, amplitude, and wave speed describe mechanical waves.

Illustrations are auto-generated and may be placeholders. They can be refreshed to match the narration.
What Makes a Wave?
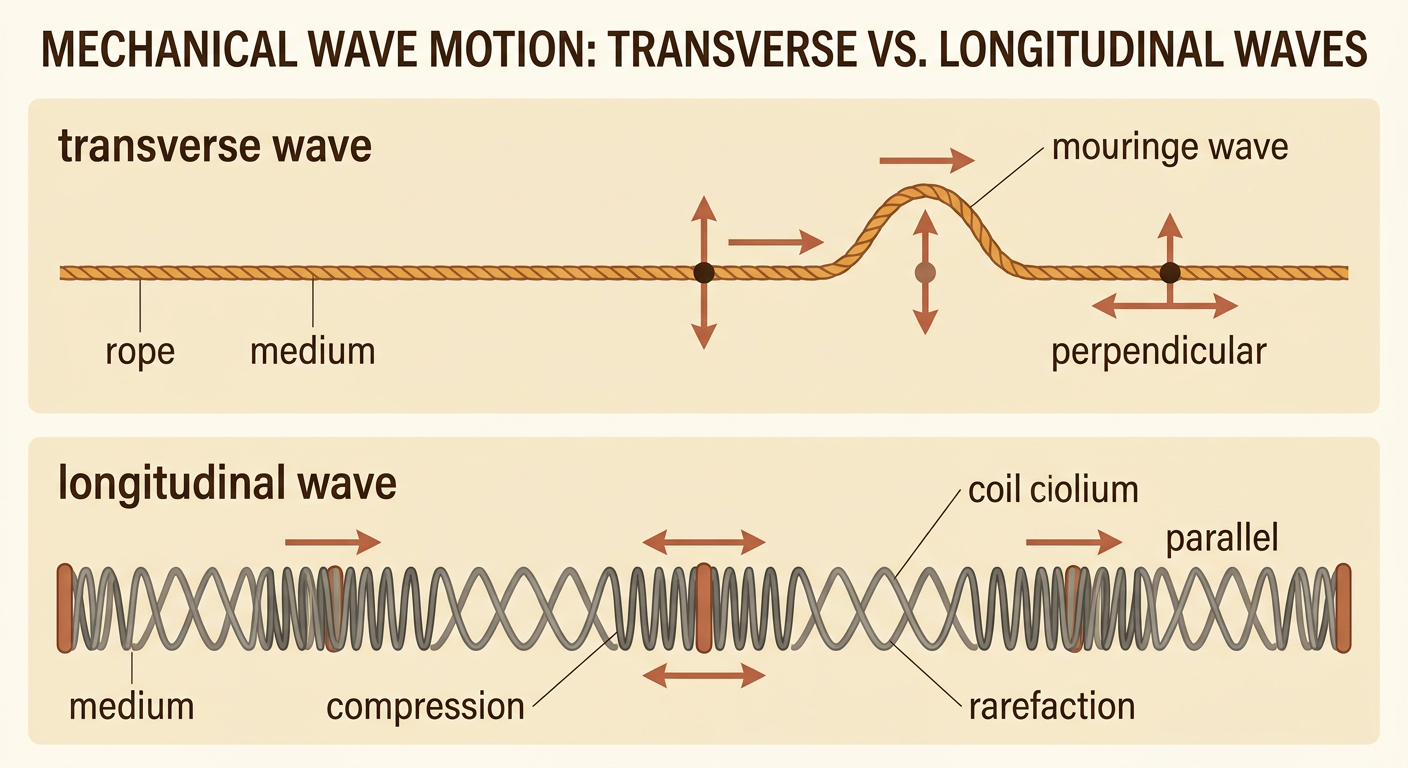
A wave is a traveling disturbance that transfers energy from one place to another without carrying matter along with it overall. A mechanical wave requires a medium, such as water, air, or a rope. In a transverse wave, particles of the medium move perpendicular to the direction the wave travels. A wave on a stretched rope is an example. In a longitudinal wave, particles move back and forth parallel to the wave’s direction, forming compressions and rarefactions. Sound in air is longitudinal. For example, when one end of a spring is pushed forward and pulled back, the coils vibrate around their original positions while the disturbance travels down the spring. The coils do not travel from one end to the other, but energy does.
Amplitude, Wavelength, and Frequency
Amplitude, wavelength, and frequency describe different features of a wave. Amplitude is the maximum displacement from the equilibrium position to a crest or trough. Greater amplitude usually means that a mechanical wave carries more energy. Wavelength, represented by the Greek letter lambda, is the distance between matching points on neighboring waves, such as crest to crest. Frequency, represented by f, is the number of complete cycles passing a point each second and is measured in hertz. One hertz equals one cycle per second. For example, if six crests pass a dock in three seconds, the frequency is 2 hertz. If neighboring crests are 4 meters apart, the wavelength is 4 meters. In the same medium, a higher-frequency wave has a shorter wavelength when wave speed remains constant.

Using the Wave Speed Equation
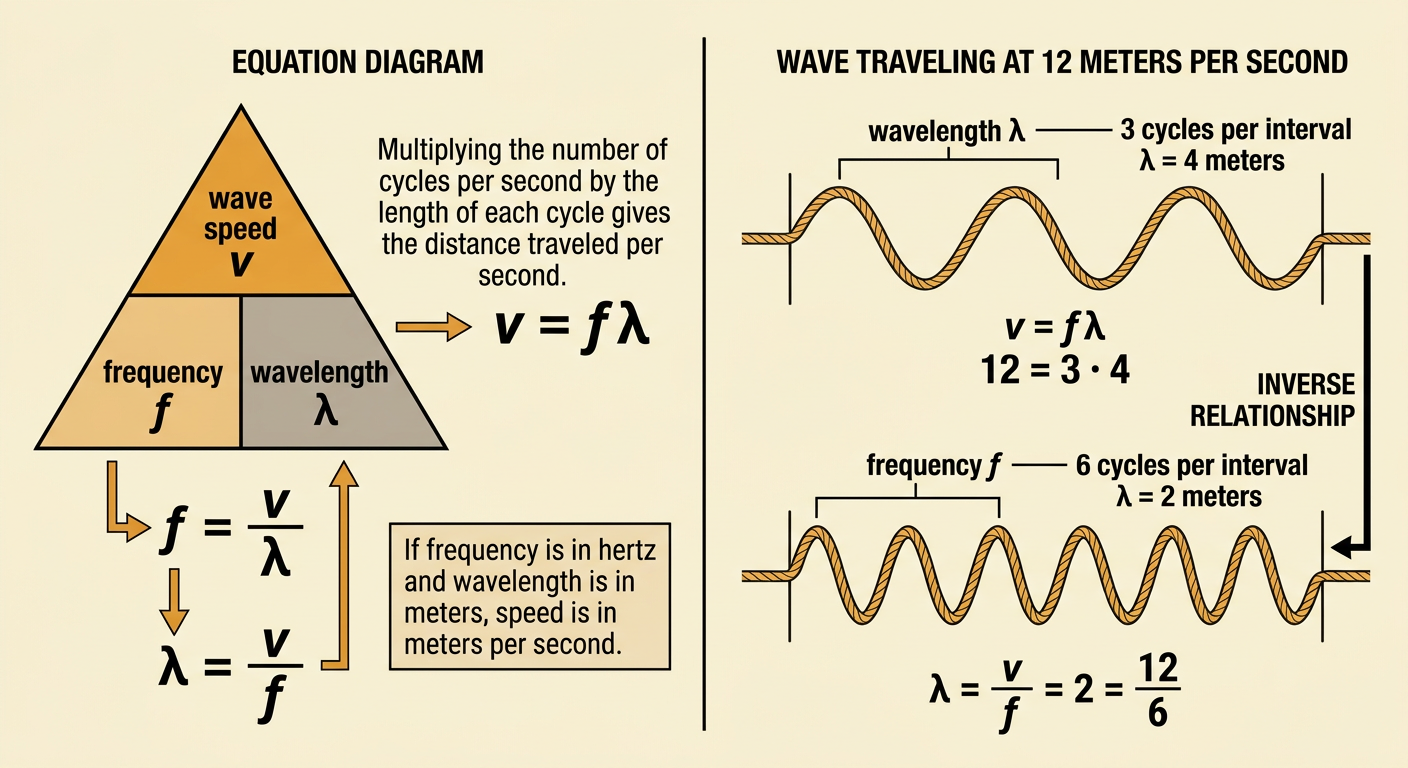
Wave speed connects frequency and wavelength through the equation v = fλ, where v is wave speed, f is frequency, and λ is wavelength. If frequency is measured in hertz and wavelength in meters, wave speed is measured in meters per second. The equation can be rearranged to highlight another quantity: f = v/λ or λ = v/f. Suppose waves on a rope travel at 12 meters per second and have a frequency of 3 hertz. Their wavelength is λ = 12/3, or 4 meters. This mathematical result supports the claim that, at constant speed, increasing frequency decreases wavelength. For example, doubling the frequency from 3 hertz to 6 hertz on the same rope would reduce the wavelength from 4 meters to 2 meters, assuming the rope’s conditions remain unchanged.
Reading Wave Diagrams and Data
A wave diagram must be read according to its axes. On a displacement-versus-position graph, amplitude is read vertically and wavelength is measured horizontally between matching points. Frequency cannot be read directly unless time or wave speed is also provided. On a displacement-versus-time graph, the horizontal distance between two matching points is the period, or time for one cycle. Frequency is calculated using f = 1/T. For example, a position graph shows crests at 2 meters and 7 meters, so the wavelength is 5 meters. A time graph shows crests at 1 second and 3 seconds, so the period is 2 seconds and the frequency is 0.5 hertz. If wavelength and frequency describe the same wave, its speed is v = 0.5 × 5, or 2.5 meters per second.

Explaining Waves in Communication Technology
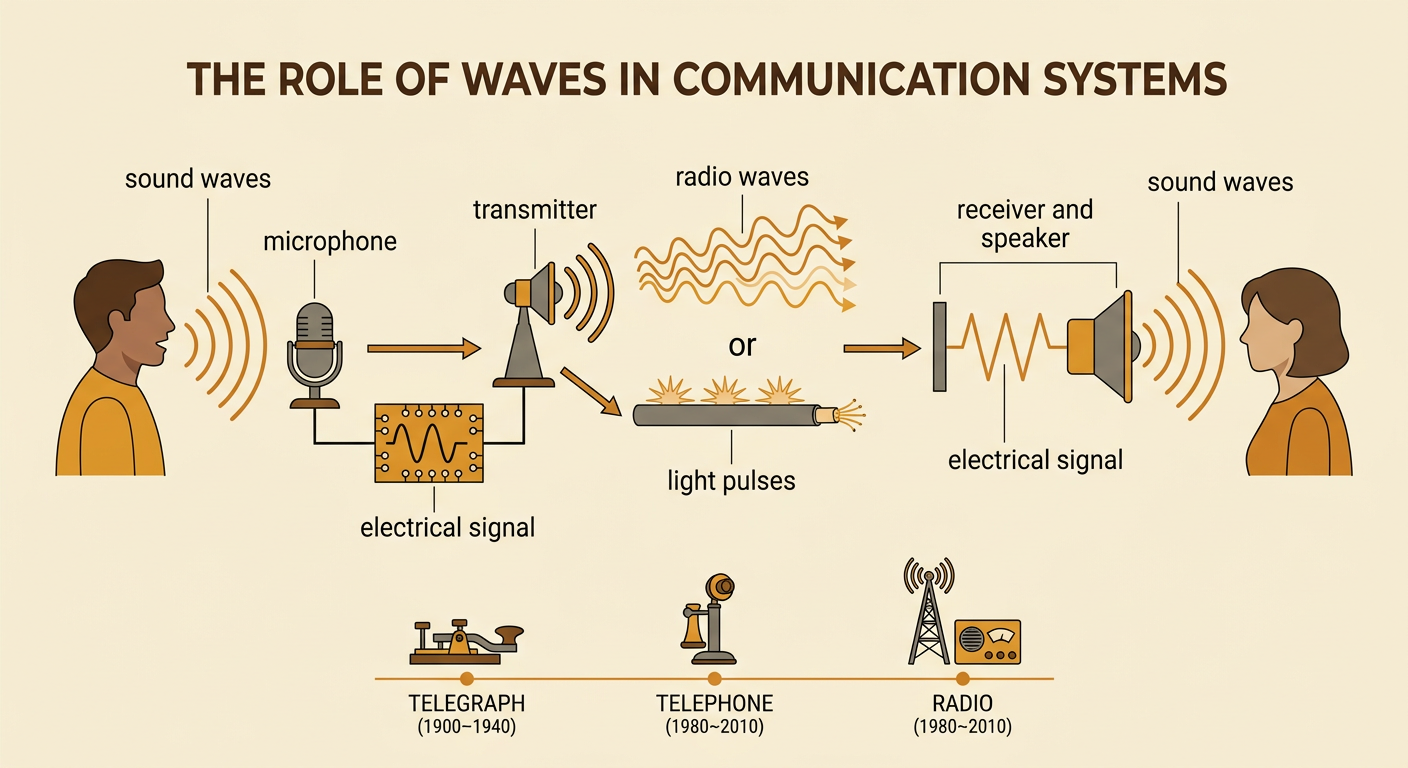
Scientific understanding of waves helped produce communication technologies, but it was one cause among several. In the nineteenth century, research on sound, electricity, and electromagnetism helped inventors develop the telegraph and telephone. A telephone microphone converts sound waves in air into an electrical signal. Modern systems may convert that signal into radio waves, electrical pulses, or light pulses for transmission. A receiver and speaker then convert the signal back into sound. These technologies also depended on materials, power sources, manufacturing, investment, and networks of wires or antennas. Faster long-distance communication changed business, journalism, government, and personal relationships by allowing information to move much faster than people or physical mail. Radio later sent information wirelessly to large audiences, contributing to shared news and entertainment while also increasing the speed at which advertising and political messages could spread.