
Modeling Waves: Amplitude, Frequency, and Energy
Students analyze and sketch wave models to explain how amplitude relates to energy, calculate frequency as cycles per second, and apply their findings to a community noise policy.
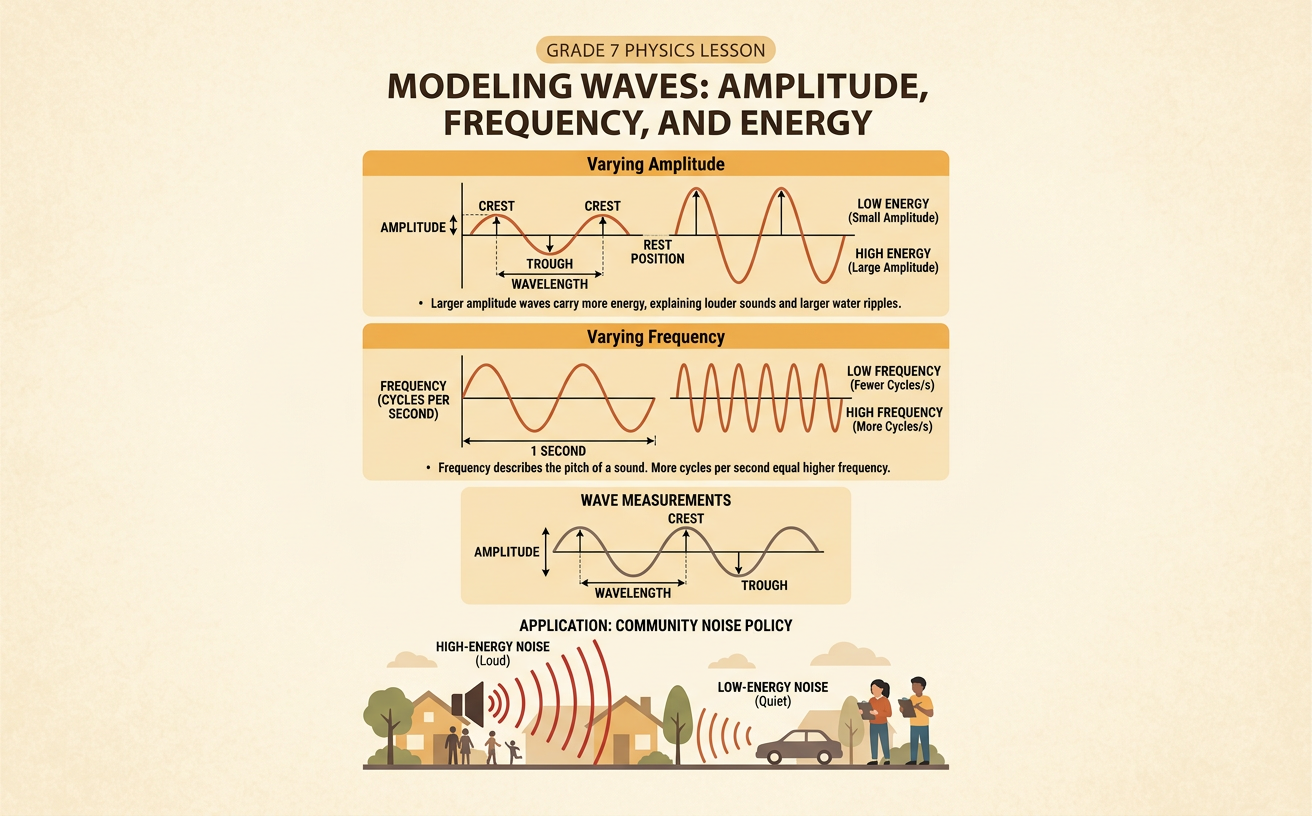
Illustrations are auto-generated and may be placeholders. They can be refreshed to match the narration.
Identify Parts of a Wave
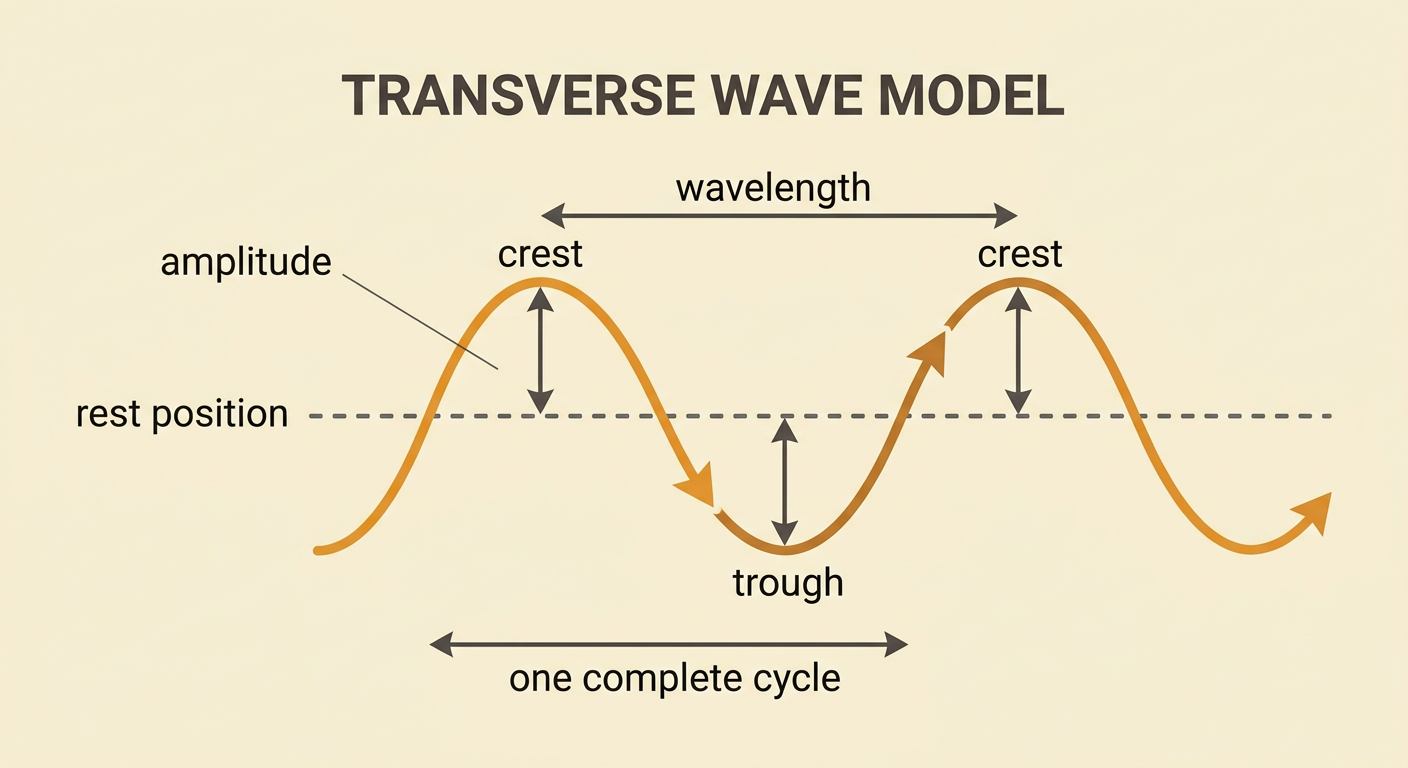
A wave model shows a repeating pattern that transfers energy from one place to another. In a transverse wave diagram, the rest position is the middle line. A crest is the highest point, and a trough is the lowest point. Amplitude is the vertical distance from the rest position to a crest or trough. Wavelength is the horizontal distance between matching points, such as one crest and the next crest. One complete cycle includes one full repeating pattern. For example, imagine a rope moving up and down. If the rope rises 5 centimeters above its rest position, its amplitude is 5 centimeters, not 10 centimeters. The distance from the top of one crest to the next crest is its wavelength.
Compare Amplitude and Energy
Amplitude describes the greatest displacement of a wave from its rest position. When two waves travel through the same medium under the same conditions, the wave with the greater amplitude carries more energy. For many simple mechanical waves, energy is proportional to the square of amplitude. This means that doubling the amplitude can produce about four times as much energy, not merely twice as much. For example, compare rope waves with amplitudes of 2 centimeters and 4 centimeters. Their amplitude ratio is 4 to 2, or 2. Their energy ratio is 2 squared, or 4, so the larger wave carries about four times the energy. This mathematical model applies only when the other wave conditions remain the same.

Calculate Frequency
Frequency is the number of complete wave cycles that pass a point each second. The unit of frequency is the hertz, abbreviated Hz. One hertz means one cycle per second. Calculate frequency by dividing the number of cycles by the elapsed time: frequency equals cycles divided by seconds. Suppose 12 complete cycles pass a point in 3 seconds. The frequency is 12 divided by 3, or 4 Hz. You can also use the rate to predict another amount. At a constant frequency of 4 Hz, 20 cycles pass in 5 seconds because 4 cycles per second times 5 seconds equals 20 cycles. Count only complete cycles and always include the correct unit in your answer.

Interpret Wave Diagrams and Data
Wave diagrams and data tables provide different kinds of evidence that can be combined. First, read the scales and units. Then measure amplitude from the rest position and count complete cycles during the stated time. Finally, connect those observations to the numerical data. For example, Wave A has an amplitude of 2 centimeters and completes 6 cycles in 3 seconds, so its frequency is 2 Hz. Wave B has an amplitude of 4 centimeters and also completes 6 cycles in 3 seconds, so it also has a frequency of 2 Hz. The diagrams show equal spacing between cycles but different heights. The table confirms that the waves have equal frequencies. Under the same conditions, Wave B has greater modeled energy because its amplitude is larger.

Apply Evidence to a Noise Policy
A community noise policy is a public rule intended to protect health and comfort while allowing necessary activities. Sound can be modeled as a wave, although sound in air is a longitudinal pressure wave. Greater sound-wave amplitude generally corresponds to greater intensity and is often perceived as louder. Frequency describes cycles per second and helps determine pitch, but pitch and loudness are not the same. Suppose measurements show that nighttime construction repeatedly produces high sound levels near homes. A policy might set lower nighttime sound limits, require quieter equipment, and allow emergency exceptions. Officials should explain how measurements will be taken, when the rule applies, and what happens after a violation. Students can evaluate consequences by asking whether the policy reduces harmful noise, can be enforced fairly, and still permits essential community work.
