
Monster Genetics Lab: Build a One-of-a-Kind Creature
Students use a coin-flip model to create monster offspring, track inherited traits, and discover how sexual reproduction produces genetic variation.
Illustrations are auto-generated and may be placeholders. They can be refreshed to match the narration.
Trait Mystery Hook
Imagine that two monster parents have four offspring. All four offspring have the same parents, yet one has striped skin, another has spotted skin, and two have plain skin. Their differences raise a mystery: Why are siblings not identical? In sexual reproduction, each parent passes genetic information to an offspring. The particular combination received by each offspring can be different. In this lab, a coin-flip model will represent that chance process. You will observe visible traits, record results, and use evidence to explain variation. Begin by comparing the pictured monster family. List observations, such as “two offspring have horns,” separately from inferences, such as “the offspring may have inherited horn information from their parents.” Careful observations help scientists form questions that models and investigations can test.
Genes, Parents, and Variation
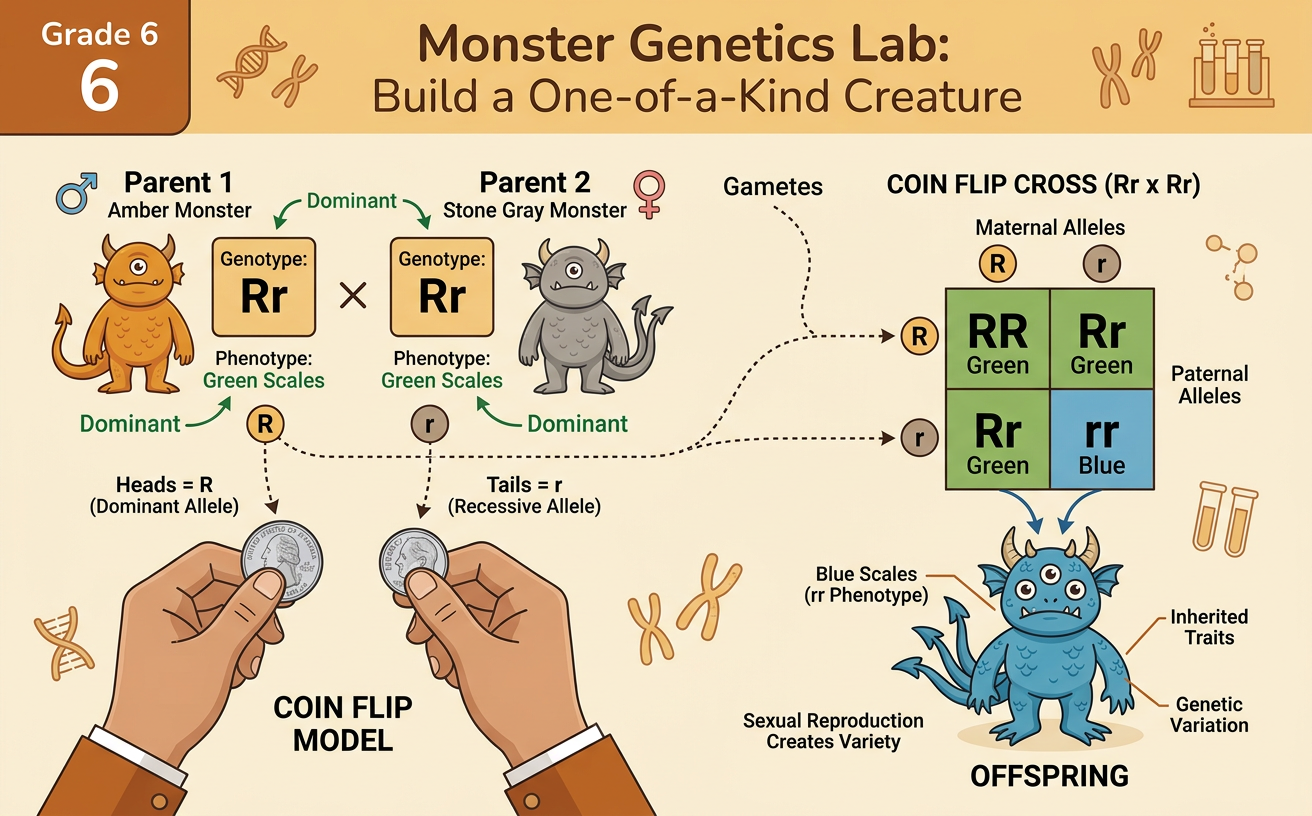
A gene is a section of DNA that helps influence a trait. Different forms of a gene are called alleles. In this simplified model, each monster has two alleles for each trait, one inherited from each parent. The allele pair is the genotype, while the observable feature is the phenotype. Suppose F is an allele for fuzzy skin and f is an allele for smooth skin. If F is dominant, monsters with FF or Ff have fuzzy skin, while only monsters with ff have smooth skin. During sexual reproduction, each parent contributes one allele for the gene. The two contributed alleles form a new pair in the offspring. Different allele combinations can therefore produce different genotypes and phenotypes. Real traits can be more complicated than this one-gene model.
Flip Coins for Inherited Traits
Use two coins for each trait: one coin represents Parent 1 and the other represents Parent 2. For a fuzzy-skin gene, let heads represent F and tails represent f. Flip both coins once. Record the allele from each parent in the order shown on your data table. Heads and tails gives Ff, while two tails gives ff. Then use the trait key to identify the phenotype. Repeat the process for every assigned trait, such as horns, eye color, or tail shape. Do not flip again because you prefer another result; chance is part of the model. For two Ff parents, the possible genotypes are FF, Ff, Ff, and ff. Over many trials, these are expected near 25%, 50%, and 25%, but a small class sample may not match those percentages exactly.
Design Your Monster Offspring
Now turn your recorded genotypes into a monster offspring. Follow the phenotype key exactly instead of choosing favorite features. For example, if your horn genotype is Hh and H is dominant, draw horns. If your tail genotype is tt and t is the recessive curled-tail allele, draw a curled tail. Add each result to the same creature, including skin texture, number of eyes, body color, and other assigned traits. Beside the drawing, create a trait card that lists each genotype and its matching phenotype. Your finished monster represents one possible offspring, not the only offspring the parents could produce. Compare it with a classmate’s monster. Even when both began with the same parent genotypes, different coin outcomes may have produced distinct allele combinations and visible features.
Graph the Class Traits
Combine the class results to look for patterns that may be hard to see in one monster. Choose one trait and count how many offspring show each phenotype. Make a bar graph with phenotype categories on the horizontal axis and number of offspring on the vertical axis. Use equal intervals and begin the number scale at zero. For example, suppose 18 of 24 monsters have fuzzy skin and 6 have smooth skin. The frequencies are 18 and 6, and the percentages are 75% and 25%. This pattern is close to the 3-to-1 phenotype ratio expected from two heterozygous parents in a simple dominant-recessive model. However, another class might get 17 and 7 because random outcomes vary. Describe the largest group, the smallest group, the difference between them, and whether the data roughly support the model’s prediction.
Model Limits and Evidence Check
A model is useful, but it is not a perfect copy of nature. Coins show chance allele selection, yet they do not show DNA, chromosome movement, mutations, or environmental effects. The activity also treats each trait as if one gene with two alleles controls it independently. In real organisms, many traits involve several genes, and some genes are inherited together. Evaluate the model with a claim, evidence, and reasoning. A claim might state that sexual reproduction produces variation. Evidence could include the class’s many genotype combinations and its 18 fuzzy to 6 smooth result. Reasoning should connect those outcomes to receiving one allele from each parent. Mendel’s repeated pea plant crosses and careful counts provided historical evidence for predictable inheritance patterns. Later investigations of chromosomes and DNA refined that explanation. Organize these sources into a coherent argument while clearly identifying what the coin model can and cannot demonstrate.