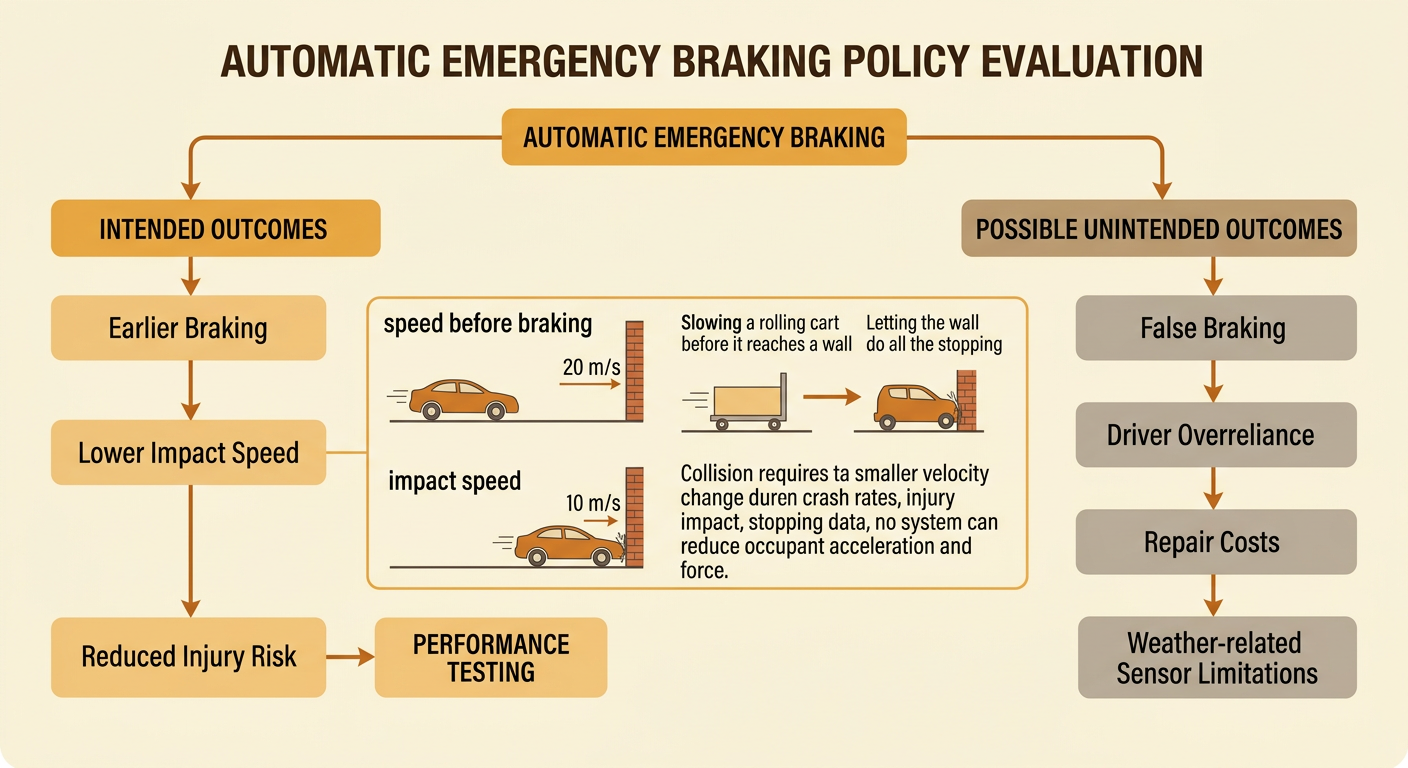
Newton’s Second Law and Vehicle Safety
Students analyze force, mass, and acceleration data to explain how Newton’s second law informs vehicle safety features and policies.
Illustrations are auto-generated and may be placeholders. They can be refreshed to match the narration.
Observe a Vehicle-Crash Scenario
Imagine a car traveling at 20 meters per second that strikes a rigid barrier. During the collision, the car’s velocity rapidly decreases to zero, so the car has a large acceleration opposite its original motion. An unrestrained passenger continues moving forward because the passenger’s body tends to maintain its velocity. The dashboard or windshield must then exert a force to stop the passenger. A seat belt begins stopping the passenger earlier and spreads the force across stronger parts of the body. To analyze the event, identify the system, the direction of motion, the forces acting on it, and the time over which its velocity changes. Observe that velocity, acceleration, and net force have directions, while mass does not. These observations provide evidence for explaining why collisions can produce large forces and how safety systems reduce injury risk.

Relate Force, Mass, and Acceleration
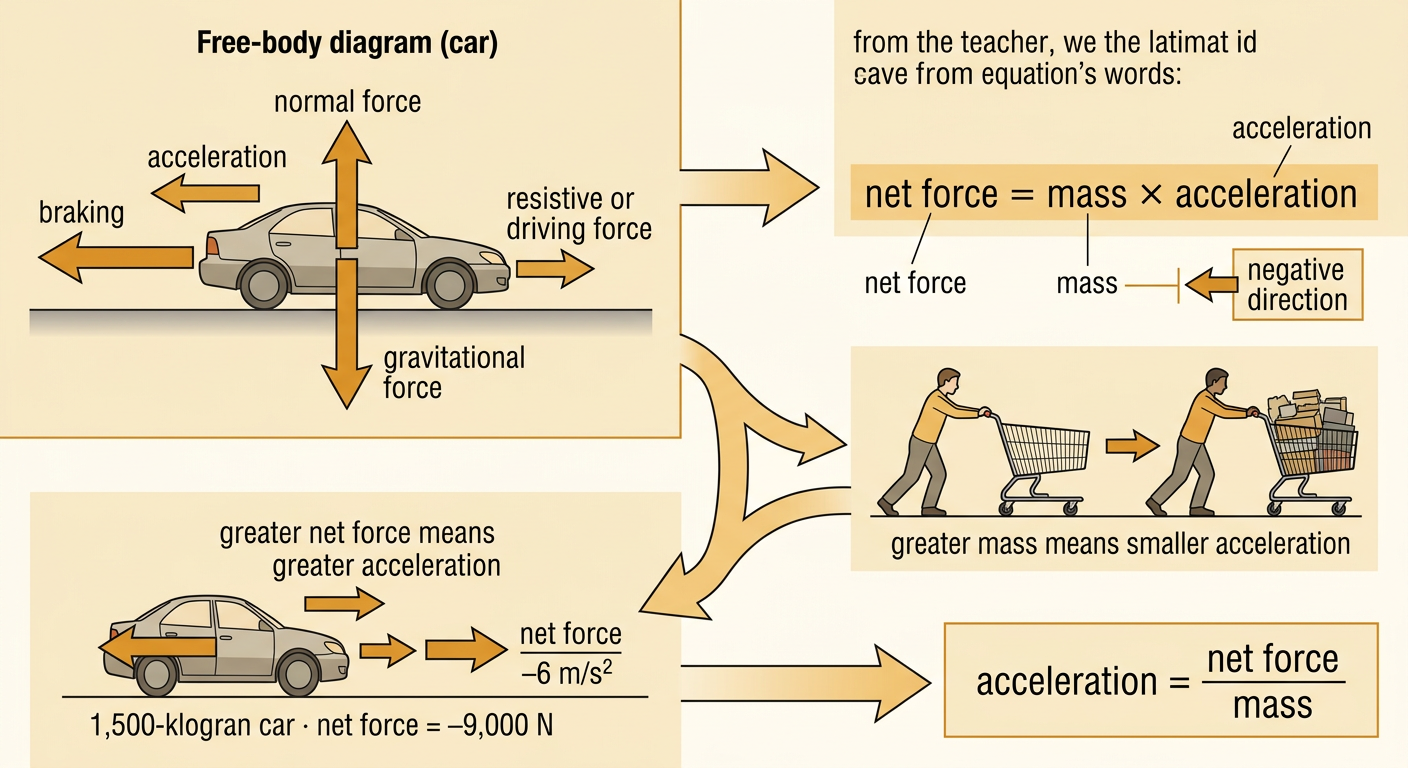
Newton’s second law states that an object’s net force equals its mass multiplied by its acceleration: Fnet = ma. Net force is the vector sum of all forces acting on the chosen system. For example, suppose a 1,500-kilogram car has an acceleration of −6 meters per second squared while moving in the positive direction. Its net force is Fnet = (1,500 kg)(−6 m/s²) = −9,000 newtons. The negative sign shows that the net force points opposite the positive direction; it does not mean the force has a negative size. For the same mass, a greater net force produces a greater acceleration. For the same net force, a more massive vehicle has a smaller acceleration. Rearranging the equation gives a = Fnet/m, which helps engineers predict how vehicles of different masses respond to braking or collision forces.
Analyze and Graph Motion Data
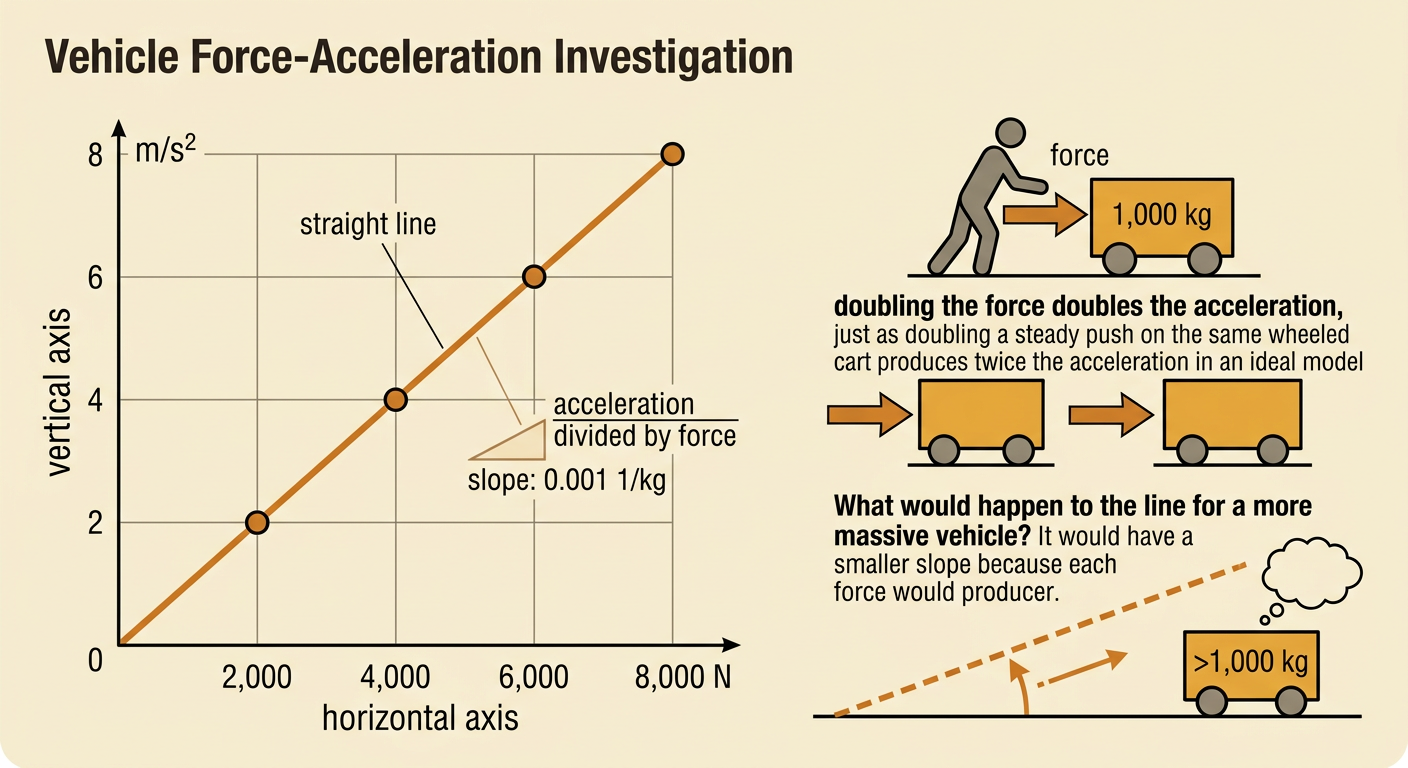
Consider tests of the same 1,000-kilogram vehicle. Net forces of 2,000, 4,000, 6,000, and 8,000 newtons produce accelerations of 2, 4, 6, and 8 meters per second squared. Plot net force on the horizontal axis and acceleration on the vertical axis using equal, labeled scales. The points form a straight line through the origin because a = Fnet/1,000. The graph’s slope is acceleration divided by force, or 0.001 kilogram⁻¹, which equals 1/m. Translating the graph into words, acceleration increases in direct proportion to net force when mass remains constant. A second vehicle with greater mass would produce a line with a smaller slope. When analyzing real data, compare points with the model, identify possible measurement uncertainty, and determine whether the overall pattern supports Newton’s second law.
Explain Safety Features Using Physics
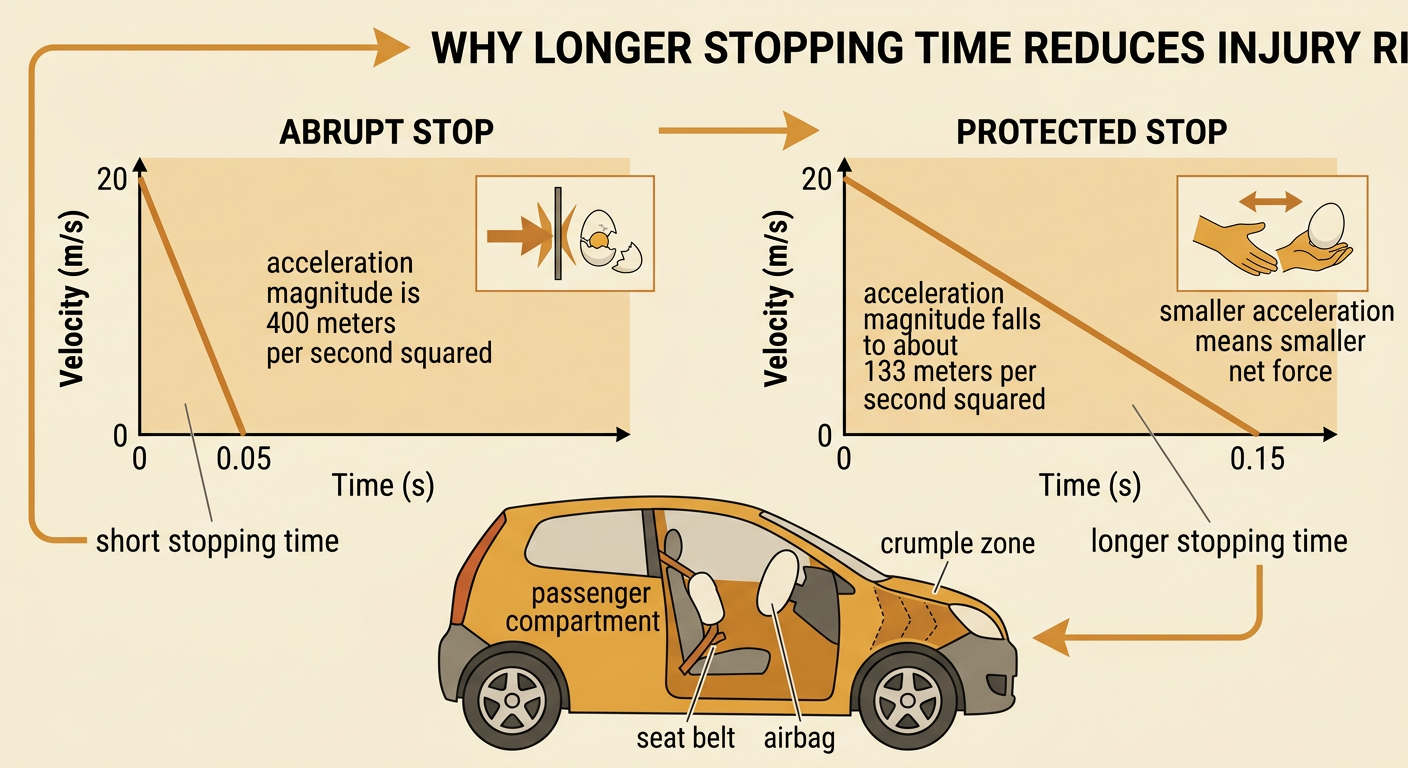
Seat belts, airbags, and crumple zones cannot eliminate the velocity change required to stop an occupant, but they can increase the stopping time and distance. Suppose an occupant’s velocity changes by 20 meters per second. If the change occurs in 0.05 second, the acceleration magnitude is 400 meters per second squared. If an airbag and seat belt extend the stopping time to 0.15 second, the acceleration magnitude is about 133 meters per second squared. Because Fnet = ma, the smaller acceleration produces a smaller net force on the same occupant. A crumple zone deforms to extend the vehicle’s stopping time and absorb energy, while the passenger compartment is designed to remain intact. Seat belts also distribute force across the pelvis and chest, and airbags reduce contact with hard surfaces. These features work together; none makes a high-speed collision harmless.
Evaluate a Vehicle Safety Policy
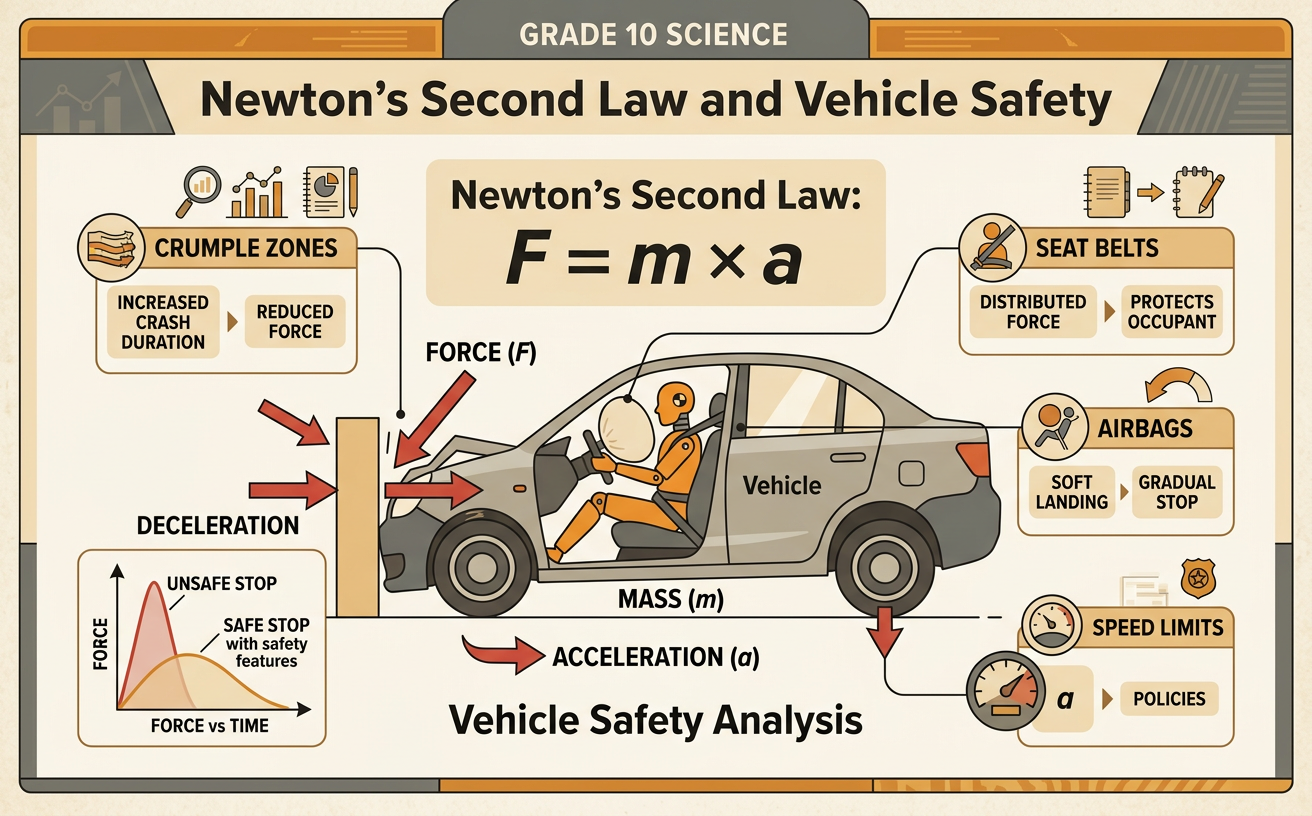
Consider a proposed policy requiring automatic emergency braking on new passenger vehicles. The intended outcome is fewer or less severe crashes because sensors can apply the brakes before impact. For example, reducing a car’s speed from 20 to 10 meters per second before a collision decreases the velocity change that must occur during impact, which can reduce acceleration and force on occupants. Evaluation should compare crash rates, injury severity, stopping data, and system performance before and after implementation. It should also examine unintended outcomes, such as false braking, driver overreliance, higher purchase or repair costs, and sensor problems in poor weather. Policymakers could require performance testing, warning systems, repair standards, and public reporting of failures. A sound conclusion weighs the quality of the evidence, the distribution of costs and benefits, and whether the policy improves safety without creating unacceptable new risks.