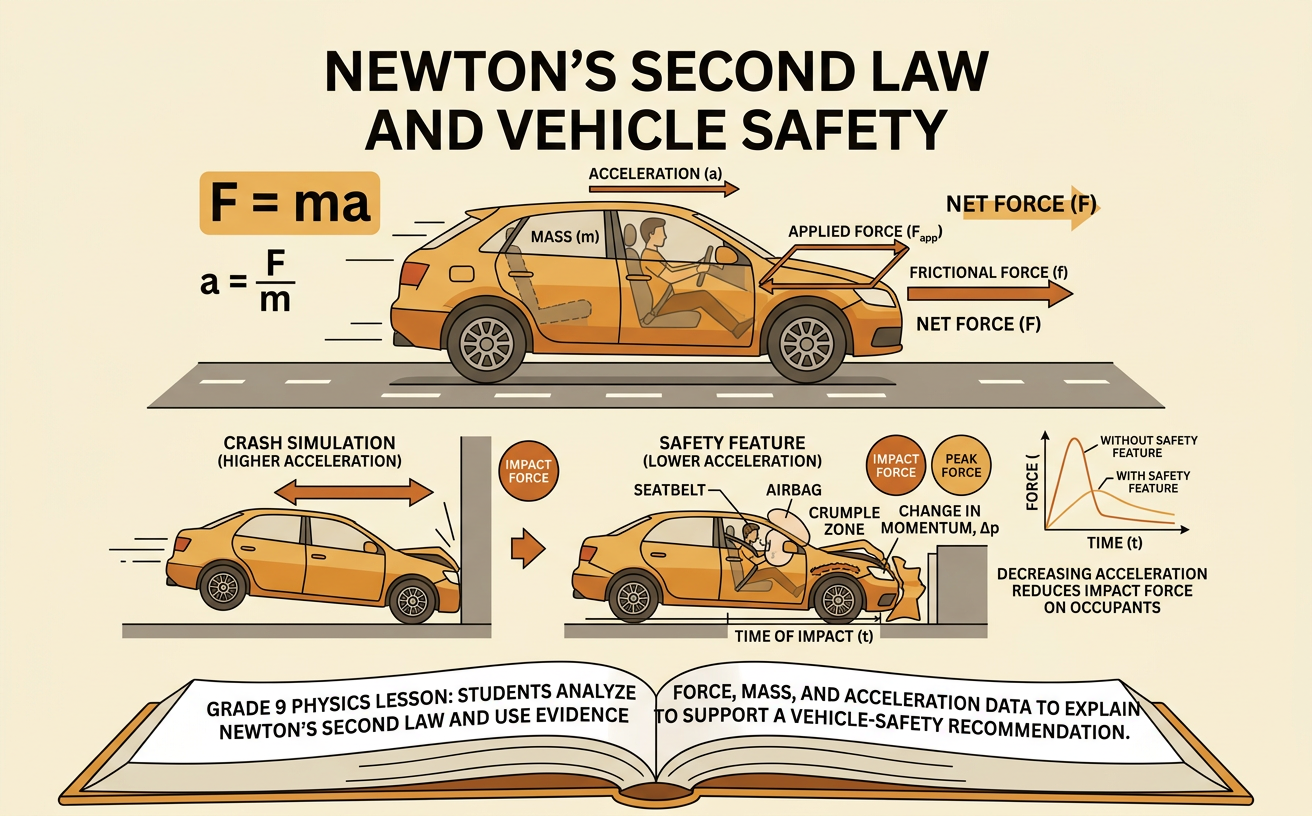
Newton’s Second Law and Vehicle Safety
Students analyze force, mass, and acceleration data to explain Newton’s second law and use evidence to support a vehicle-safety recommendation.
Illustrations are auto-generated and may be placeholders. They can be refreshed to match the narration.
Observe a Vehicle-Safety Scenario
Imagine a 1,200-kilogram car traveling at 15 meters per second when it hits a barrier. If the front of the car stops in 0.10 second, its average acceleration is −150 meters per second squared. The negative sign means the velocity changes opposite the direction of motion. Using F = ma, the average net force on the car is −180,000 newtons. A crumple zone can lengthen the stopping time. If it increases the time to 0.30 second, the average acceleration becomes −50 meters per second squared, and the average net force becomes −60,000 newtons. Real collisions are more complex, but this simplified comparison reveals an important safety principle: increasing stopping time can reduce the magnitude of acceleration and force. Seat belts and airbags help occupants slow down with the vehicle rather than strike the interior suddenly.

Review Force, Mass, and Acceleration
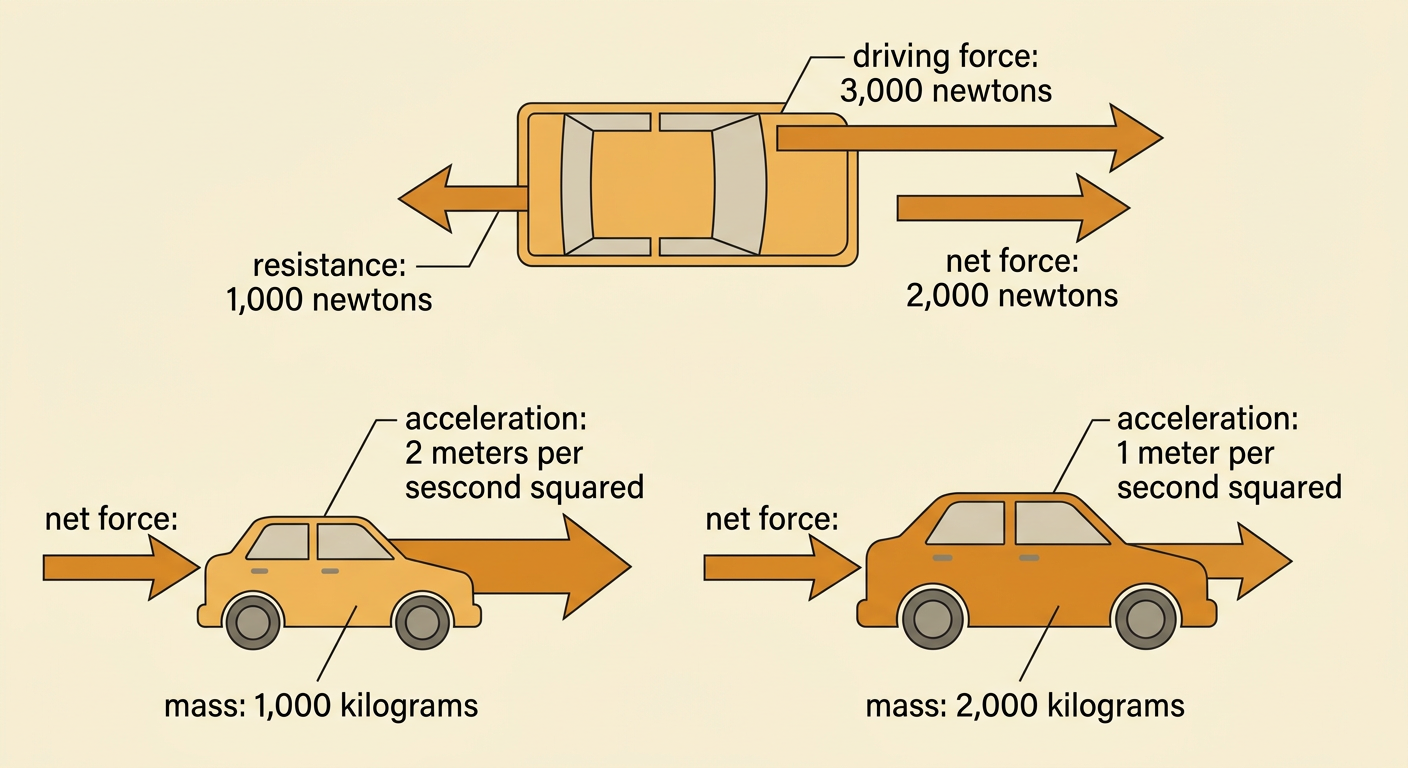
Newton’s second law states that an object’s acceleration depends on its net force and mass. Net force is the vector sum of all forces acting on the object, so direction matters. Consider a 1,000-kilogram car with a 3,000-newton driving force forward and 1,000 newtons of air resistance and friction backward. The net force is 3,000 N − 1,000 N = 2,000 N forward. The car therefore accelerates forward at 2 meters per second squared. If the same net force acted on a 2,000-kilogram vehicle, its acceleration would be only 1 meter per second squared. Greater net force produces greater acceleration when mass stays constant. Greater mass produces less acceleration when net force stays constant. Balanced forces produce zero acceleration, although the vehicle may still move at constant velocity.
Calculate Using F = ma
Use Newton’s second law in the form F = ma, where F is net force in newtons, m is mass in kilograms, and a is acceleration in meters per second squared. Suppose a 1,500-kilogram vehicle accelerates at 3.0 meters per second squared. Its net force is F = (1,500 kg)(3.0 m/s²) = 4,500 N. The units confirm the result because one newton equals one kilogram-meter per second squared. You can rearrange the equation to find acceleration: a = F/m. If a 6,000-newton net force acts on the same vehicle, its acceleration is 6,000 N ÷ 1,500 kg = 4.0 m/s². Always use net force, not just one force, and include direction. During braking, a negative acceleration indicates that the acceleration points opposite the chosen positive direction.

Analyze Force and Acceleration Data
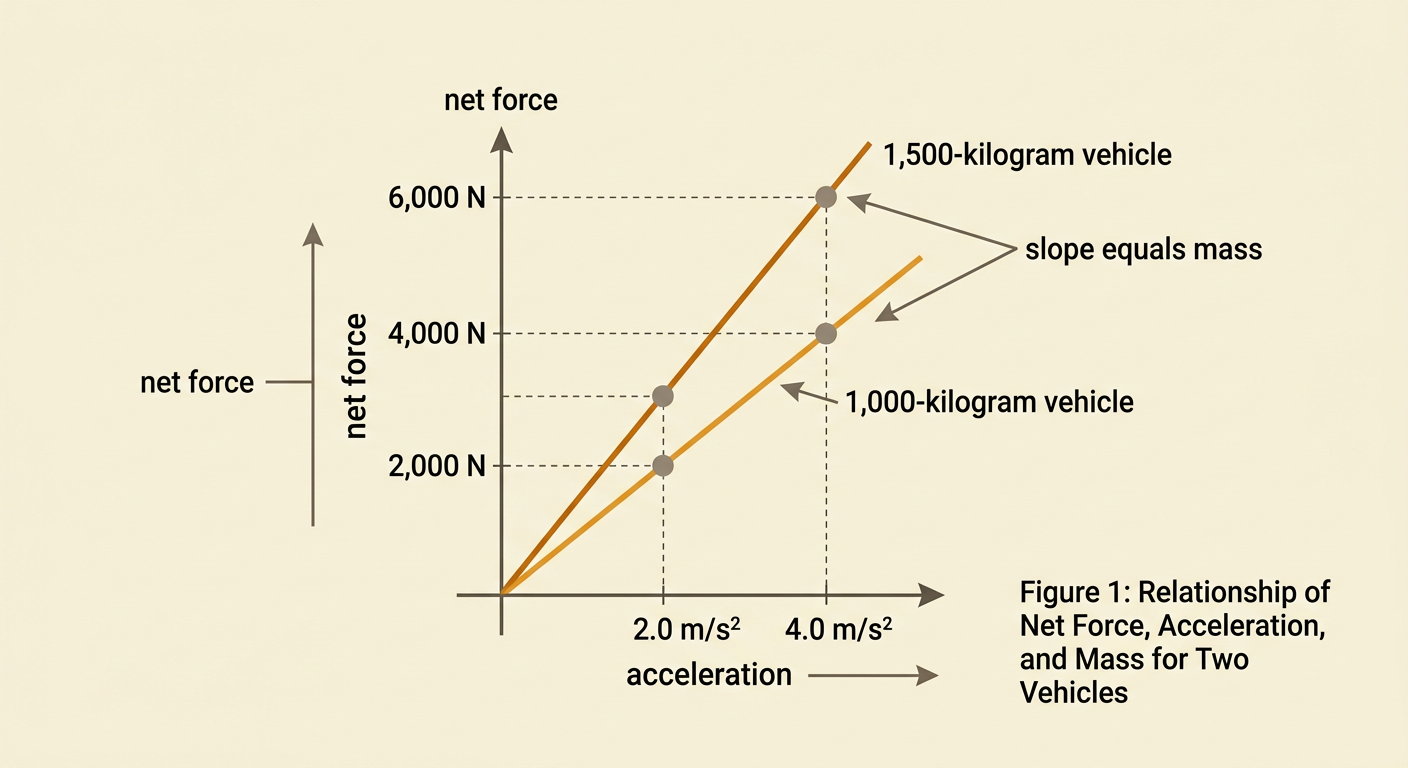
A vehicle test provides four data points. A 1,000-kilogram vehicle accelerates at 2.0 meters per second squared under a 2,000-newton net force and at 4.0 meters per second squared under 4,000 newtons. A 1,500-kilogram vehicle accelerates at 2.0 meters per second squared under 3,000 newtons and at 4.0 meters per second squared under 6,000 newtons. For either mass, doubling net force doubles acceleration. For equal acceleration, the heavier vehicle requires a proportionally greater force. On a force-versus-acceleration graph, each vehicle’s points form a straight line through the origin. Because F = ma, the slope of each line equals mass. The 1,500-kilogram vehicle has the steeper line. The numerical table and visual graph both support Newton’s second law and allow patterns to be checked in two forms.
Make an Evidence-Based Safety Claim
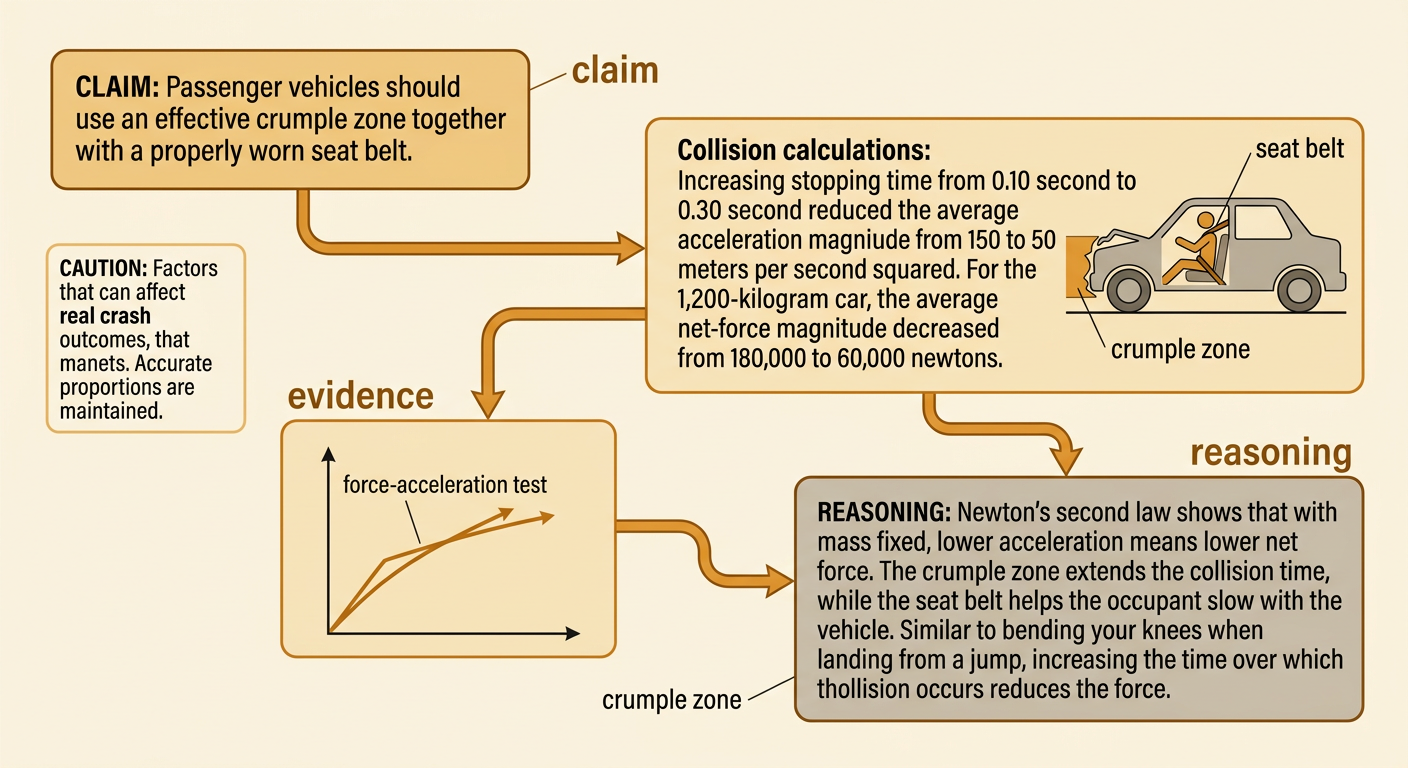
A strong safety argument includes a precise claim, relevant evidence, and reasoning that connects the evidence to physics. One recommendation is that passenger vehicles should use effective crumple zones together with properly worn seat belts. In the collision example, increasing stopping time from 0.10 second to 0.30 second reduced the magnitude of average acceleration from 150 to 50 meters per second squared. For the 1,200-kilogram car, the calculated average net-force magnitude decreased from 180,000 to 60,000 newtons. Test data also show that force and acceleration change proportionally when mass is constant. Newton’s second law therefore explains why reducing acceleration reduces net force. A seat belt helps the occupant slow with the vehicle, while the crumple zone extends the collision time. A complete argument should also acknowledge limitations: average values do not show brief peak forces, and actual crash outcomes depend on speed, impact direction, restraint use, and vehicle design.