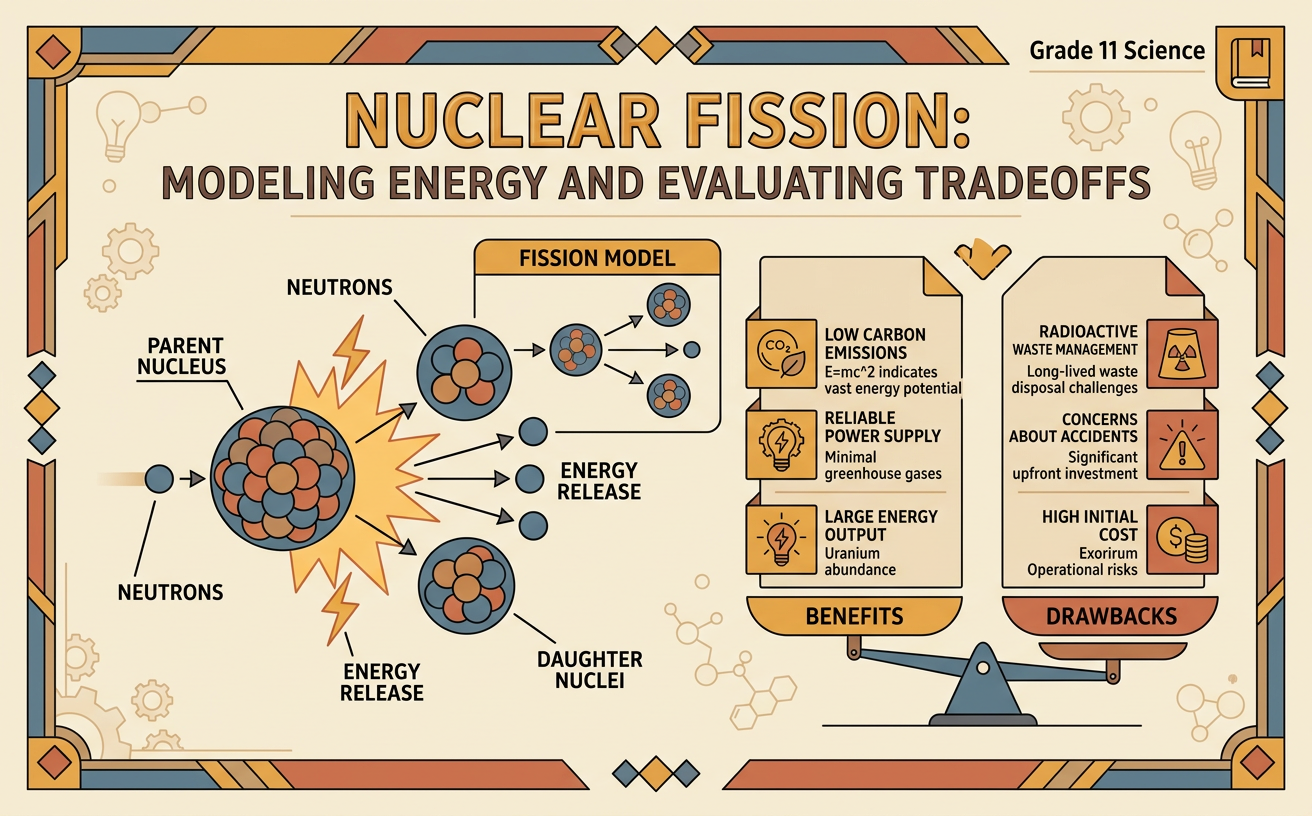
Nuclear Fission: Modeling Energy and Evaluating Tradeoffs
Students model how nuclear fission changes atomic nuclei and releases energy, then use scientific and economic evidence to assess nuclear power as an energy source.
Illustrations are auto-generated and may be placeholders. They can be refreshed to match the narration.
Inside the Atomic Nucleus
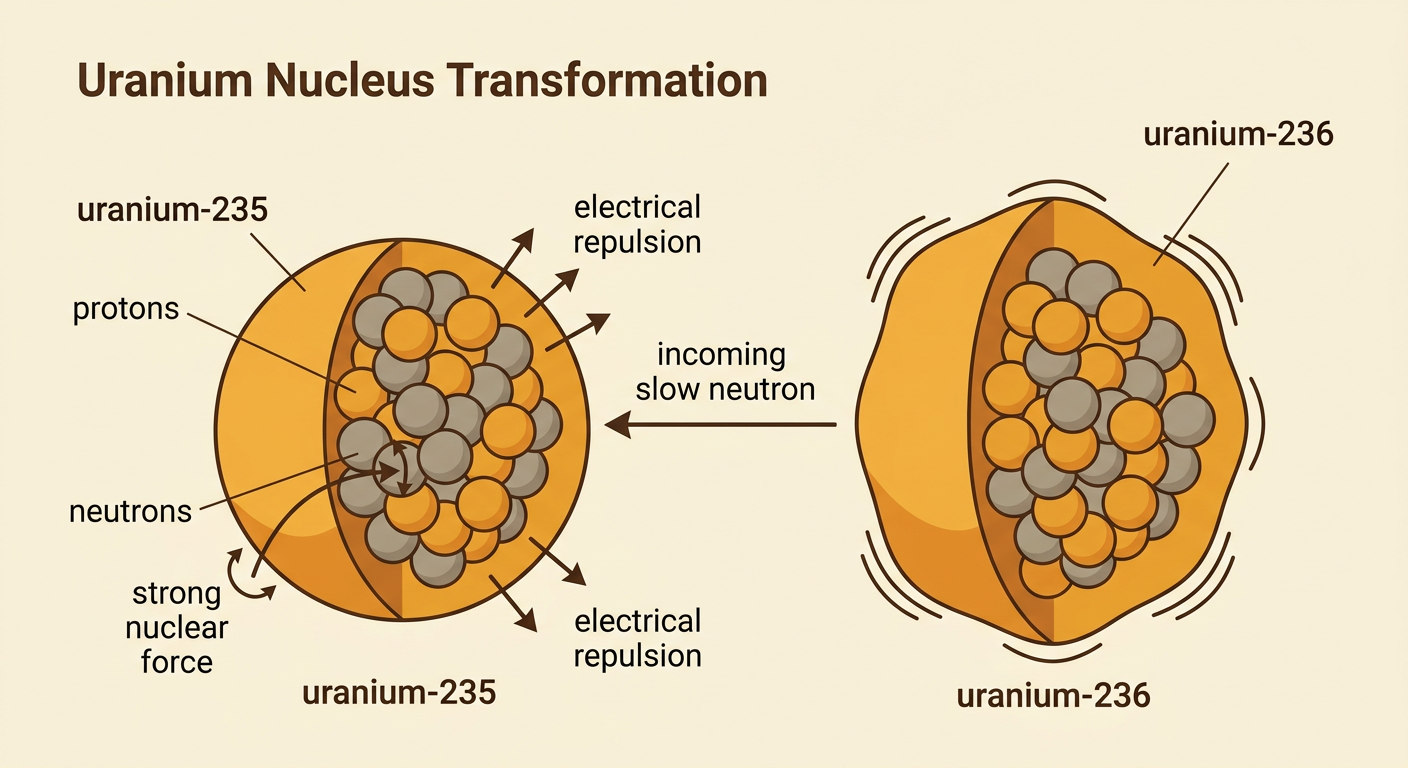
An atom has a tiny nucleus containing positively charged protons and neutral neutrons. The number of protons identifies the element, while atoms of the same element can have different numbers of neutrons, forming isotopes. Uranium-235, for example, has 92 protons and 143 neutrons. The strong nuclear force attracts nearby protons and neutrons, helping hold the nucleus together despite electrical repulsion among protons. Very large nuclei can be unstable because the strong force acts only across extremely short distances. If a uranium-235 nucleus absorbs a slow neutron, it becomes an excited uranium-236 nucleus. The added energy and changed arrangement can make the nucleus deform and split. A nuclear model should track proton number, neutron number, total nucleon number, and energy rather than drawing the nucleus as a rigid ball.
Modeling a Fission Chain Reaction
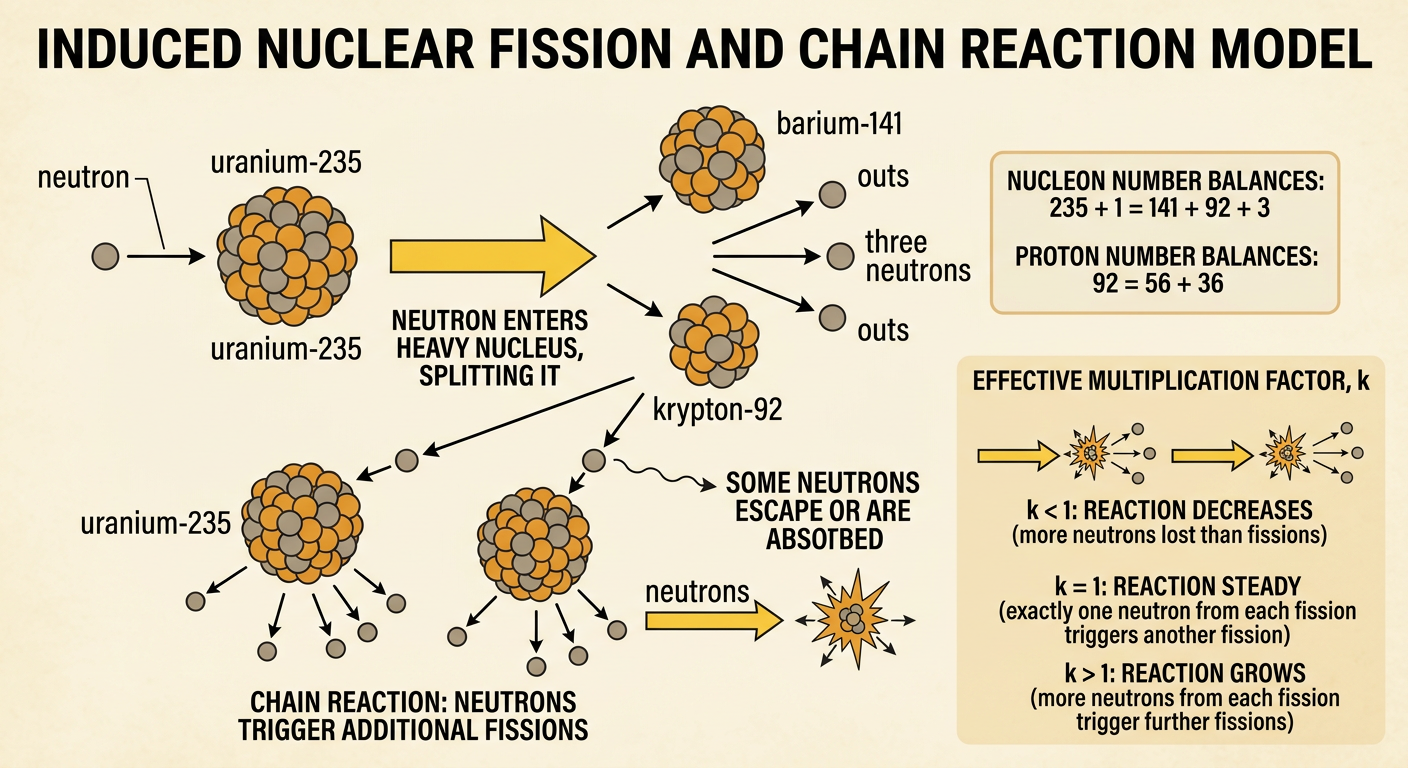
In induced fission, a neutron is absorbed by a heavy nucleus, which then splits into two smaller nuclei and releases additional neutrons. One possible reaction is uranium-235 plus one neutron producing barium-141, krypton-92, and three neutrons. The nucleon numbers balance: 235 + 1 = 141 + 92 + 3. The proton numbers also balance: 92 = 56 + 36. Released neutrons may strike other uranium-235 nuclei, producing a chain reaction. In a simplified model, one fission releases three neutrons, but some escape or are absorbed without causing fission. The effective multiplication factor, k, describes the change between generations. If k is less than 1, the reaction decreases; if k equals 1, it is steady; if k is greater than 1, it grows.
Mass-Energy Conversion
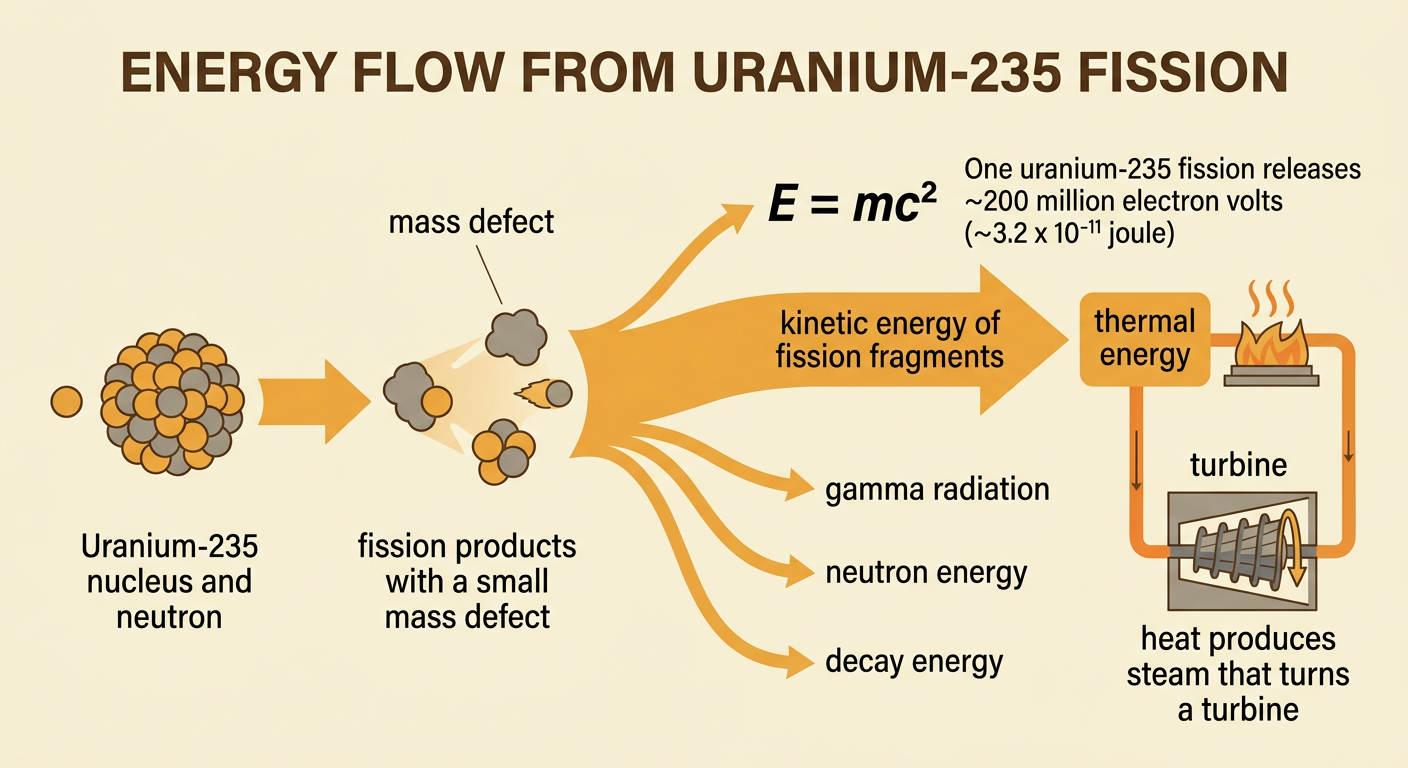
Fission products and released neutrons have slightly less total mass than the original nucleus and absorbed neutron. This difference is called the mass defect. It is converted into energy according to Einstein’s equation, E = mc², where c is the speed of light. Because c² is extremely large, a tiny mass change produces substantial energy. A typical uranium-235 fission releases about 200 million electron volts, or roughly 3.2 × 10⁻¹¹ joule. Most appears as kinetic energy of the two fission fragments; smaller portions appear in neutrons, gamma radiation, and later radioactive decays. When fragments collide with surrounding material, their motion becomes thermal energy. In a power plant, this heat helps produce steam that turns a turbine. Energy is conserved because the lost rest mass reappears as other forms of energy.
Reading Nuclear Energy Data
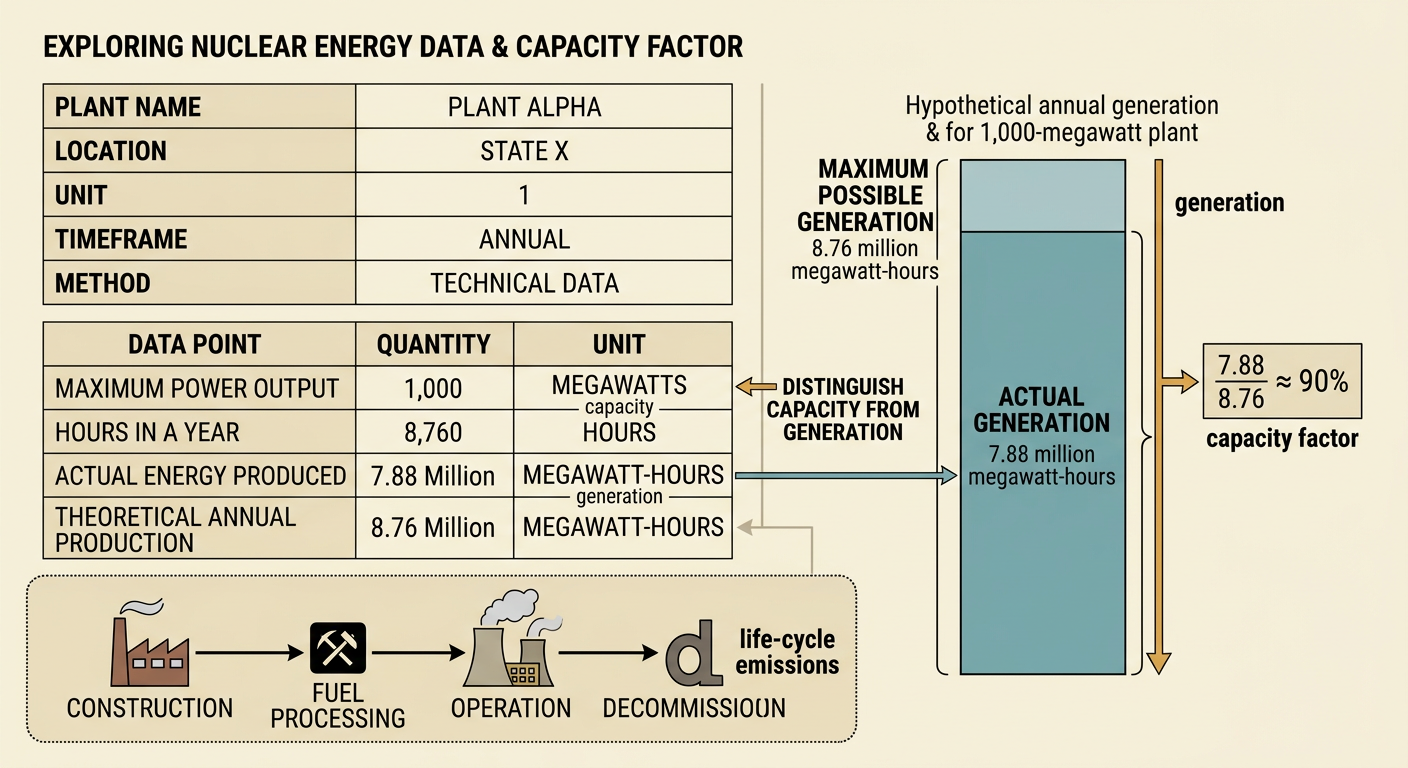
Evaluating nuclear power requires integrating graphs, tables, technical diagrams, and reliable source descriptions. First check the quantity, unit, time period, geographic area, and method used. Capacity is the maximum possible power output, measured in watts, while generation is energy produced over time, often measured in megawatt-hours. Capacity factor compares actual generation with the amount a plant could produce while operating at full power. For example, a 1,000-megawatt plant operating at full output for 8,760 hours could generate 8.76 million megawatt-hours in one year. If it actually generates 7.88 million megawatt-hours, its capacity factor is about 90 percent. A life-cycle emissions graph includes construction, fuel processing, operation, and decommissioning, so it should not be confused with a graph showing only direct emissions during operation.
Benefits, Costs, and Risks
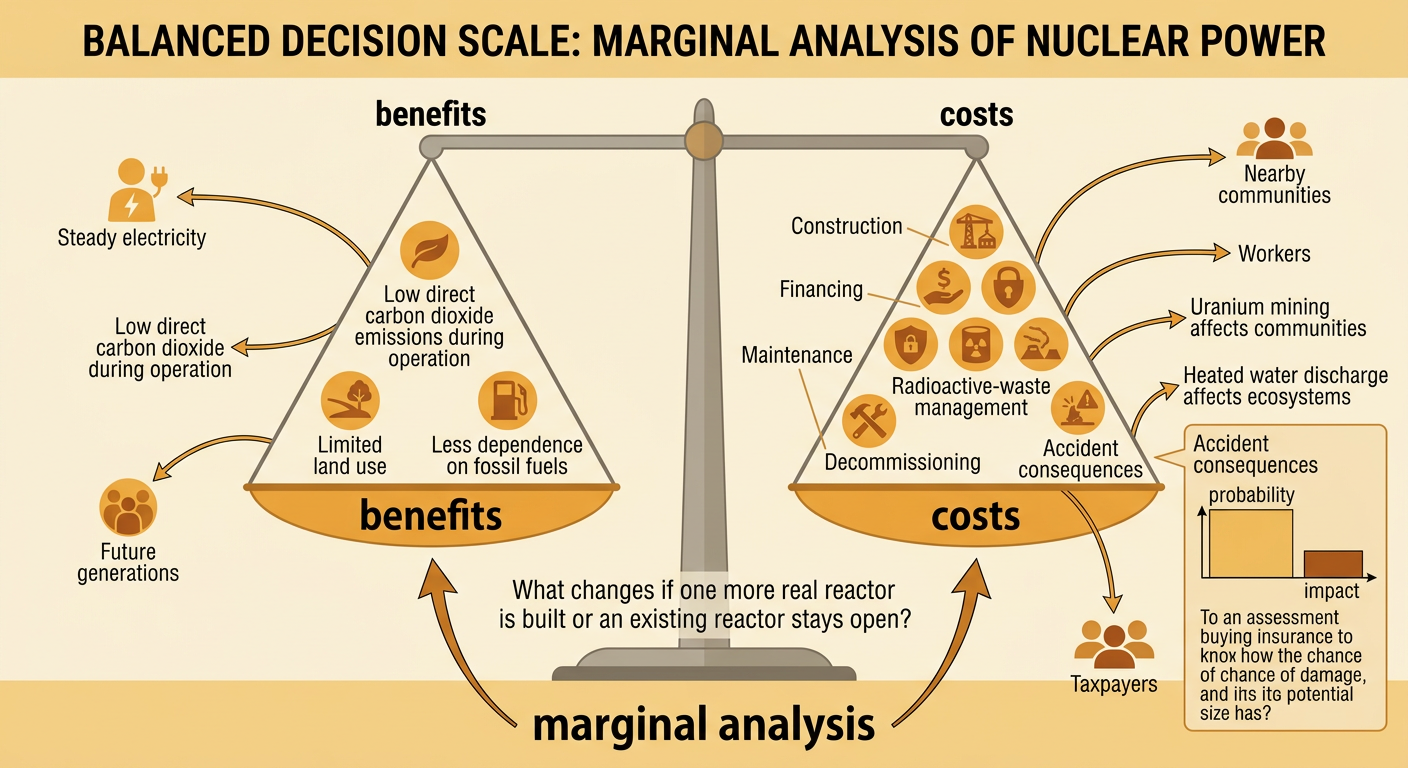
Nuclear power offers benefits and imposes costs that occur at different times and affect different groups. Benefits can include large amounts of steady electricity, low direct carbon dioxide emissions during operation, limited land use per unit of electricity, and reduced dependence on fossil fuels. Costs include expensive construction, financing, security, maintenance, decommissioning, and long-term management of radioactive waste. Accidents are uncommon but can have serious health, environmental, and economic consequences, so both probability and impact matter. Uranium mining and heated water discharge can also affect communities and ecosystems. Marginal analysis asks what changes if one additional reactor is built or one existing reactor remains open. For example, the marginal benefit might be reliable low-carbon generation, while the marginal cost might include new safety upgrades and waste storage. Evidence should identify who receives each benefit and who bears each cost or risk.
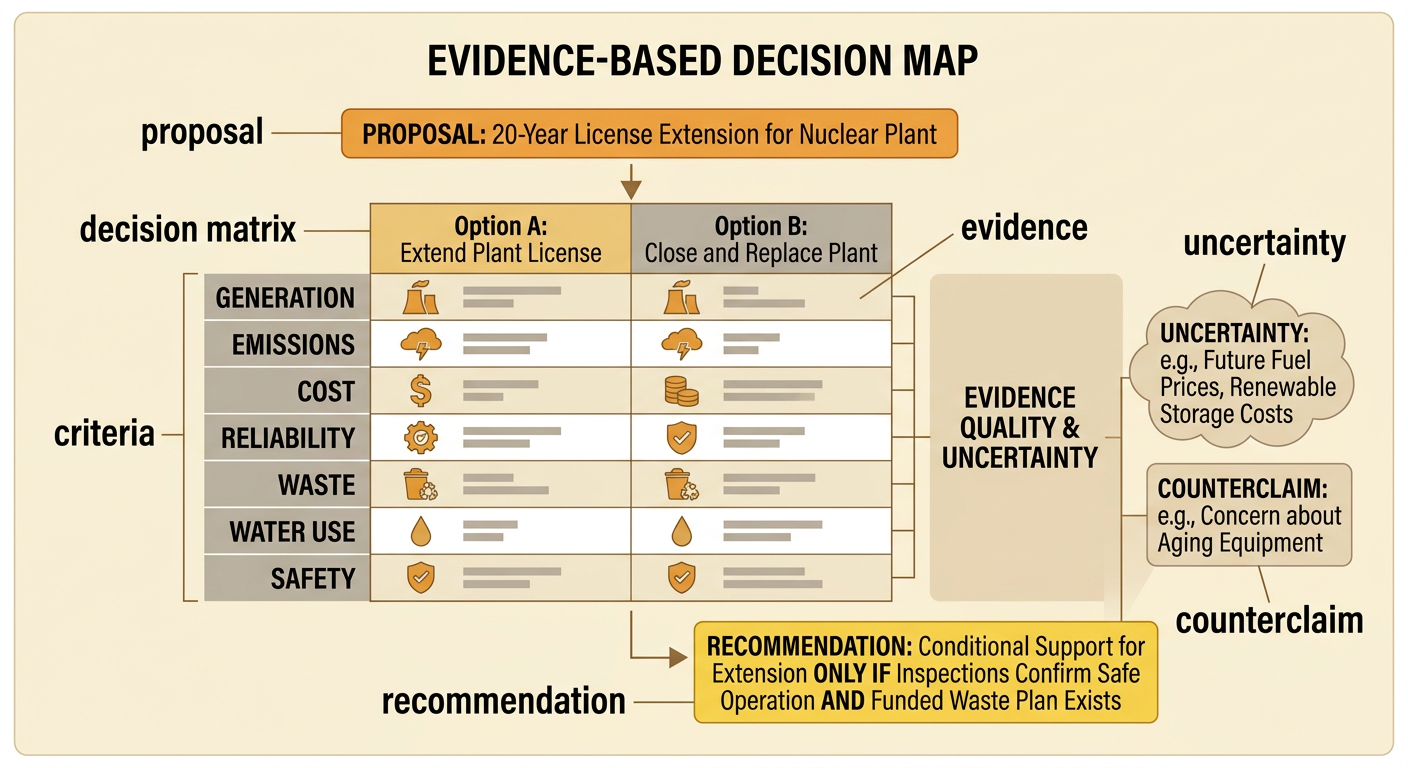
Evidence-Based Energy Decision
An evidence-based energy decision begins with a specific proposal, clear criteria, and comparable data. Imagine a state considering whether to extend a nuclear plant’s license for 20 years. Students could compare projected electricity generation, life-cycle greenhouse gas emissions, operating and safety-upgrade costs, waste plans, reliability, water use, and replacement options. A strong claim might support the extension only if inspections confirm safe operation and a funded waste-management plan exists. The argument should connect each piece of evidence to a criterion rather than listing facts. It should also address uncertainty, such as changing fuel prices or future renewable-energy storage costs, and respond to a reasonable counterclaim. Marginal reasoning focuses on the consequences of extending this plant compared with closing it now. The final recommendation may be conditional because scientific evidence informs the choice, while economic priorities and community values influence how tradeoffs are weighted.