Ocean Acidification: Carbon Chemistry and Marine Ecosystems
Students analyze chemical equations and data to explain how atmospheric carbon dioxide lowers ocean pH and affects marine organisms and coastal economies.

Illustrations are auto-generated and may be placeholders. They can be refreshed to match the narration.
Carbon Dioxide Enters the Ocean
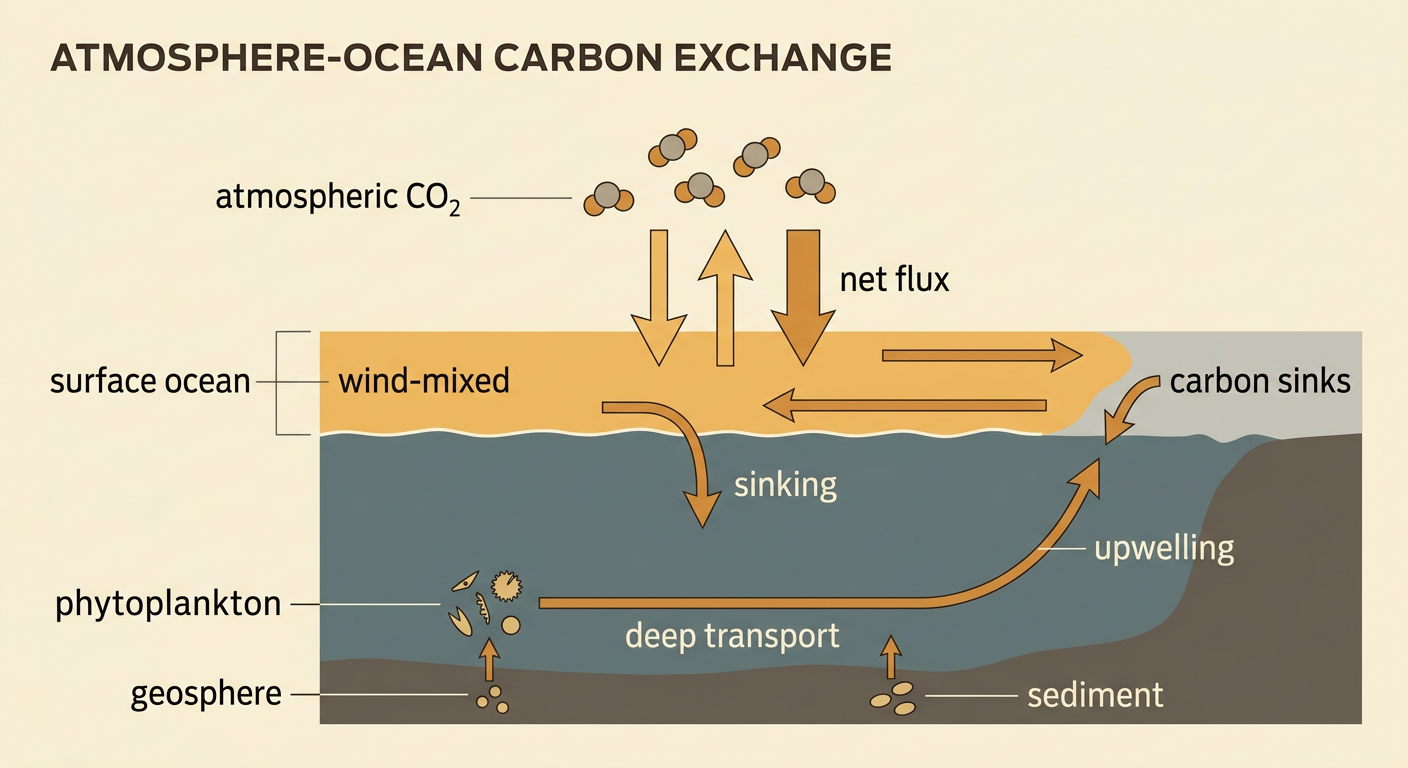
Carbon moves between the atmosphere and surface ocean by diffusion across the air-sea boundary. When atmospheric CO₂ rises, more molecules collide with the water and dissolve, especially where winds mix the surface. The net flux can be represented as F = k(Cair − Cwater), where k summarizes wind, temperature, and other exchange conditions; this is a simplified quantitative model, not a complete description. Cold water generally holds more dissolved gas than warm water, so high-latitude oceans are important carbon sinks. Currents then transport dissolved carbon into deeper water, while upwelling can return carbon-rich water to the surface. For example, if atmospheric CO₂ increases while surface-water CO₂ initially stays constant, the concentration difference grows and net movement into the ocean increases. Photosynthesis, respiration, and sediment burial connect this exchange to the biosphere and geosphere.
Carbonic Acid and Shifting pH
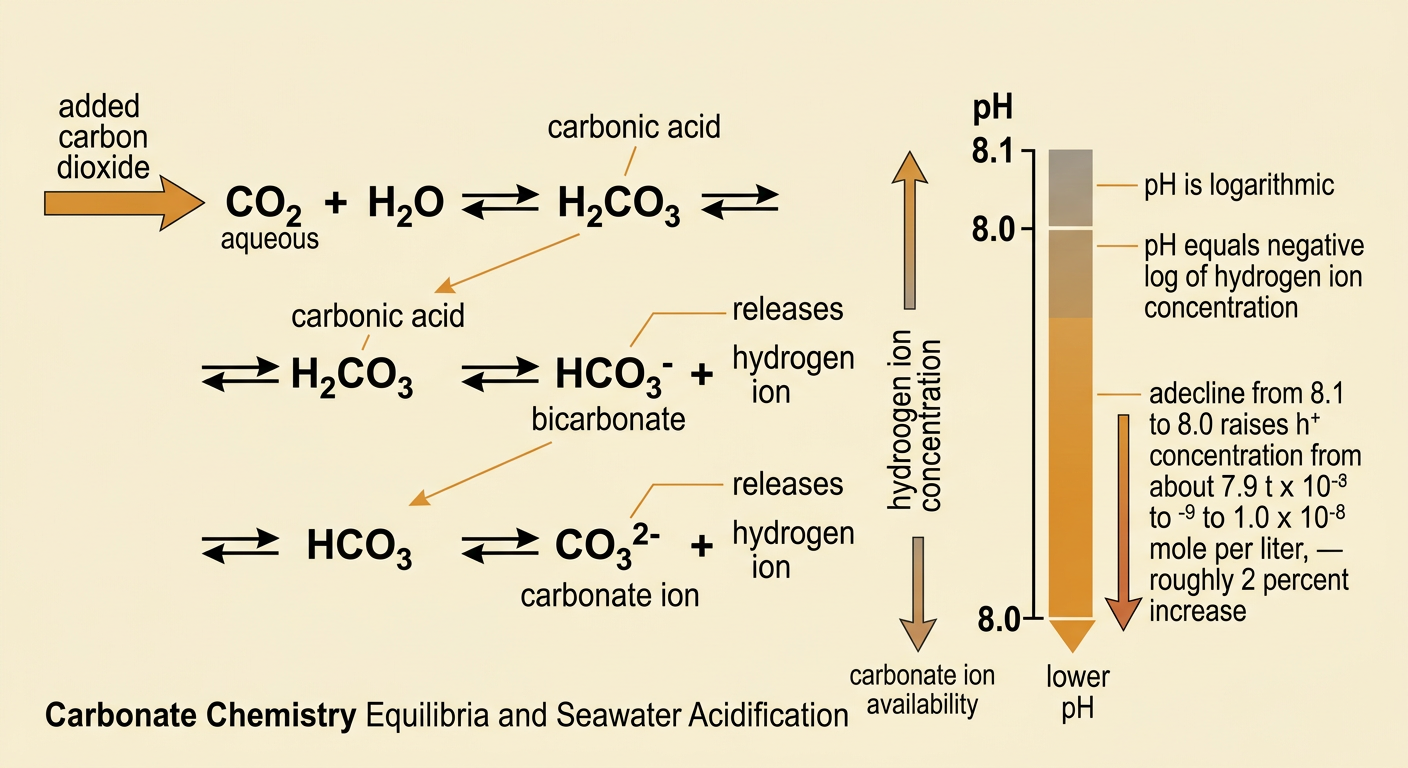
Dissolved carbon dioxide reacts through a series of reversible chemical equilibria. First, CO₂(aq) + H₂O ⇌ H₂CO₃ forms carbonic acid. Carbonic acid can donate a proton: H₂CO₃ ⇌ H⁺ + HCO₃⁻. Bicarbonate can also dissociate: HCO₃⁻ ⇌ H⁺ + CO₃²⁻. Adding CO₂ shifts these linked reactions toward more hydrogen ions and less carbonate ion, lowering pH. Because pH = −log[H⁺], the scale is logarithmic. A decline from pH 8.1 to 8.0 means hydrogen ion concentration rises from about 7.9 × 10⁻⁹ to 1.0 × 10⁻⁸ mole per liter, an increase of roughly 26%. Seawater at pH 8.0 is still basic, but it is more acidic than seawater at pH 8.1. Natural buffering slows the change but does not prevent it.
Interpreting Carbon Dioxide and pH Data
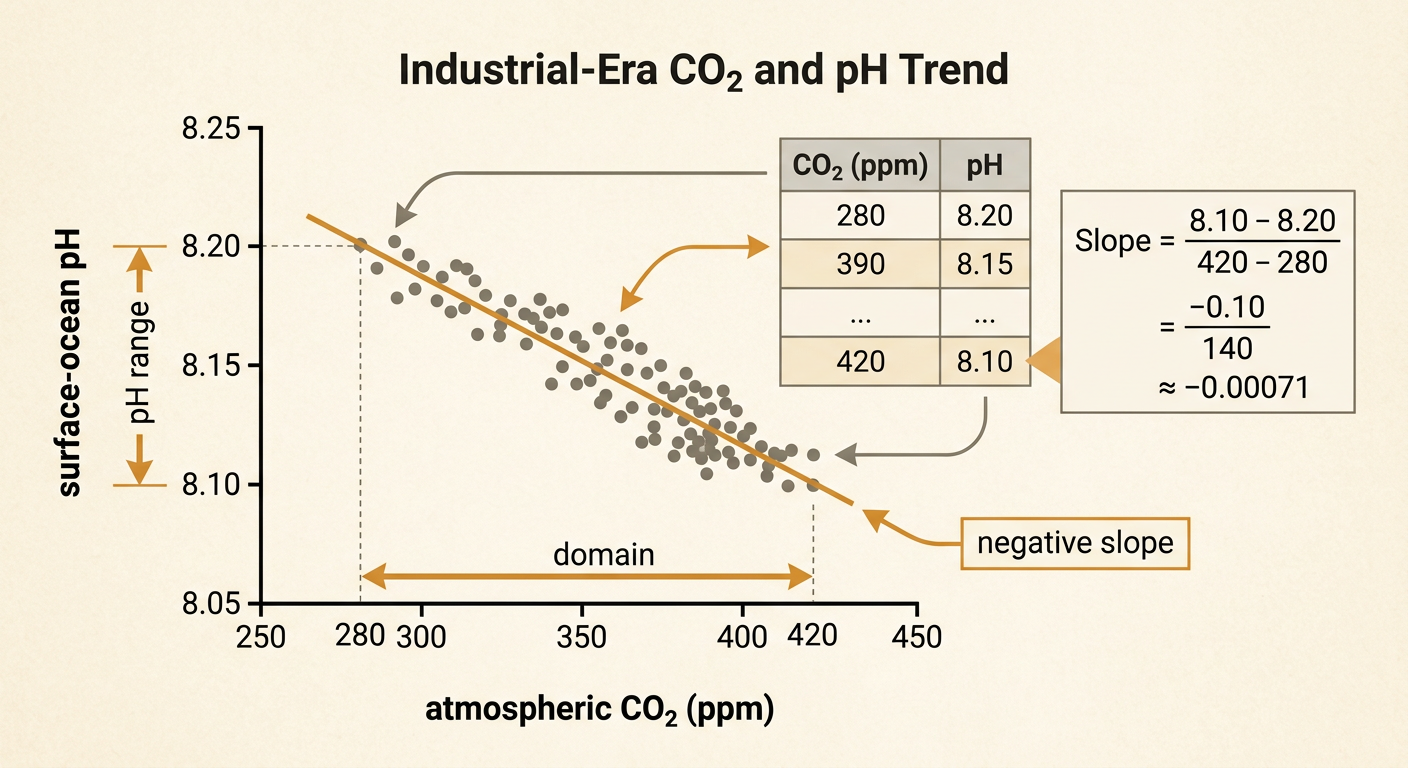
A table and line graph can reveal both trend and scale. Consider a simplified data set representing the industrial-era relationship: atmospheric CO₂ rises from 280 to 420 parts per million while mean surface-ocean pH falls from about 8.20 to 8.10. The endpoint slope is (8.10 − 8.20)/(420 − 280), or about −0.00071 pH unit per part per million. This negative slope summarizes the interval; it does not mean every location or year follows a straight line. The graph’s domain is 280–420 ppm, its pH range is 8.10–8.20, and its key feature is a downward association. Because pH is logarithmic, the 0.10-unit drop represents about 26% more hydrogen ions, not a 1% change. Comparing the graph with the equilibrium equations supports a mechanism, although temperature, circulation, and biology explain scatter in observations.
Effects on Shell-Building Organisms
Corals, oysters, clams, mussels, and pteropods use calcium and carbonate ions to build calcium carbonate structures: Ca²⁺ + CO₃²⁻ ⇌ CaCO₃. Acidification converts more carbonate into bicarbonate, leaving less carbonate available for calcification. Scientists describe this condition with the saturation state, Ω = [Ca²⁺][CO₃²⁻]/Ksp. When Ω is greater than 1, mineral formation is chemically favored; when it falls below 1, unprotected calcium carbonate tends to dissolve. Biology, food supply, and shell coatings also influence actual outcomes. For example, pteropod shells exposed to low-saturation seawater can develop visible surface damage, while oyster larvae may spend more energy building their first shells and less energy growing. Responses differ by species and life stage, and warming or low oxygen can strengthen the stress.

Consequences for Fisheries and Coastal Communities
Ocean acidification can affect communities through ecological and economic networks. Shellfish growers, wild fisheries, processors, restaurants, and exporters depend on reliable survival and harvests. Along the U.S. Pacific Northwest, seasonal upwelling can bring naturally carbon-rich, low-pH water onto the continental shelf; added human-caused carbon can intensify corrosive conditions. Oyster hatcheries have experienced larval production problems during such events and have responded with monitoring and controlled water treatment. If shellfish supply falls, dockside income and processing jobs may decline, prices may rise, and buyers may shift toward imports or different species. Effects vary spatially: communities with diversified economies have more alternatives than remote towns or Tribal nations with strong cultural and subsistence ties. Adaptation can also alter land use as aquaculture facilities relocate, install treatment systems, or compete for suitable waterfront sites.

Evidence-Based Mitigation Strategies
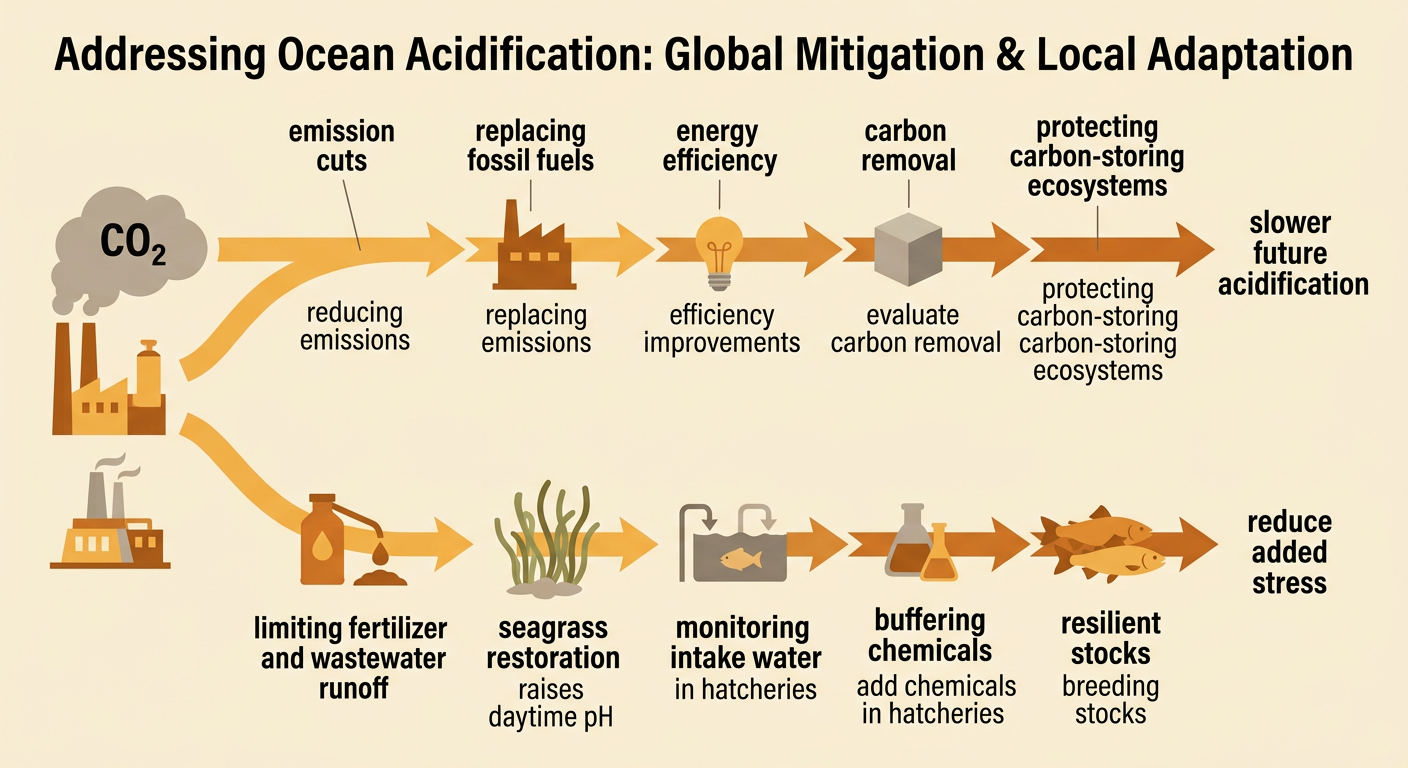
The most direct long-term mitigation is reducing carbon dioxide emissions, because atmospheric CO₂ drives the global change in ocean carbonate chemistry. Replacing fossil fuels, improving energy efficiency, protecting carbon-storing ecosystems, and developing carefully evaluated carbon removal can slow future acidification. Local actions cannot replace emission cuts, but they can reduce additional stress. Limiting fertilizer and wastewater runoff can decrease respiration-driven acidity in some coastal waters. Restoring seagrass may raise daytime pH nearby through photosynthesis, although the effect varies by season, location, and nighttime respiration. Shellfish hatcheries can monitor intake water, add buffering chemicals under controlled conditions, or breed more resilient stocks. Students can compare strategies using measurable criteria such as expected pH benefit, carbon reduction, cost, time scale, and ecological side effects. Strong conclusions should rely on repeated observations and transparent models rather than a single experiment or graph.