Optimizing a Fixed Budget with Dynamic Programming
Students solve a knapsack-style budget allocation problem by defining subproblems, completing a dynamic programming table, and tracing the selected items.

Illustrations are auto-generated and may be placeholders. They can be refreshed to match the narration.
Define the Budget Constraint
Suppose a school technology club has a fixed budget of $10 and may purchase each resource at most once. A tutoring app costs $6 and provides 9 benefit points. A sensor kit costs $5 and provides 8 points. A reference book costs $4 and provides 7 points. Cloud credits cost $3 and provide 4 points. The goal is to maximize total benefit without spending more than $10. This is a zero-one knapsack problem because each item is either selected or not selected. Begin by identifying the constraint, the available choices, and the quantity to maximize. A valid combination stays within the budget. For example, the sensor kit and reference book cost $9 and provide 15 benefit points, while purchasing all four items is impossible because their total cost is $18.

See Why a Greedy Choice Can Fail
A greedy strategy makes the choice that looks best at the moment. One possible rule is to rank items by benefit per dollar. The reference book has a ratio of 7 ÷ 4 = 1.75, the sensor kit has 8 ÷ 5 = 1.6, the tutoring app has 9 ÷ 6 = 1.5, and the cloud credits have 4 ÷ 3, or about 1.33. Following this ranking, the greedy method selects the book and sensor kit. They cost $9 and provide 15 points, but no remaining item fits in the last $1. This result is not optimal. The tutoring app and reference book cost exactly $10 and provide 16 points. Greedy reasoning fails because a locally efficient choice can prevent a more valuable combination later.

Form the Dynamic Programming Recurrence
Dynamic programming avoids relying on one immediate choice by solving smaller versions of the problem. Define DP[i][b] as the greatest benefit possible using the first i items with a budget limit of b dollars. The base cases are DP[0][b] = 0 because no items provide no benefit, and DP[i][0] = 0 because a zero-dollar budget buys nothing. If item i costs more than b, it cannot be selected, so DP[i][b] = DP[i − 1][b]. If it fits, compare excluding it with including it. The recurrence is DP[i][b] = max(DP[i − 1][b], benefit[i] + DP[i − 1][b − cost[i]]). For the reference book at budget $10, compare 9 without it to 7 + DP[2][6] = 16 with it.
![A decision diagram for DP[i][b] branches between excluding and including an item, then selects the maximum value.](https://ucvtuxkxaejwzkresyhm.supabase.co/storage/v1/object/sign/lesson-images/e927f339-7f41-4481-839e-8f49e62ad72a/section-15222090-d006-4a56-abcd-cc6d38c3976c-1789185236811.png?token=eyJraWQiOiI0MmU2NWE1NC1hZTc5LTRlZTgtYmJlMi0wZjMwNGFjM2U2ODEiLCJhbGciOiJIUzI1NiJ9.eyJ1cmwiOiJsZXNzb24taW1hZ2VzL2U5MjdmMzM5LTdmNDEtNDQ4MS04MzllLThmNDllNjJhZDcyYS9zZWN0aW9uLTE1MjIyMDkwLWQwMDYtNGE1Ni1hYmNkLWNjNmQzOGMzOTc2Yy0xNzg5MTg1MjM2ODExLnBuZyIsInNjb3BlIjoiZG93bmxvYWQiLCJpYXQiOjE3ODkxODUyMzcsImV4cCI6MjEwNDU0NTIzN30.51LHnwWxxNVbLn-19y1If1PUAoYxP-ZidktzRYFiE7g)
Complete the Solution Table
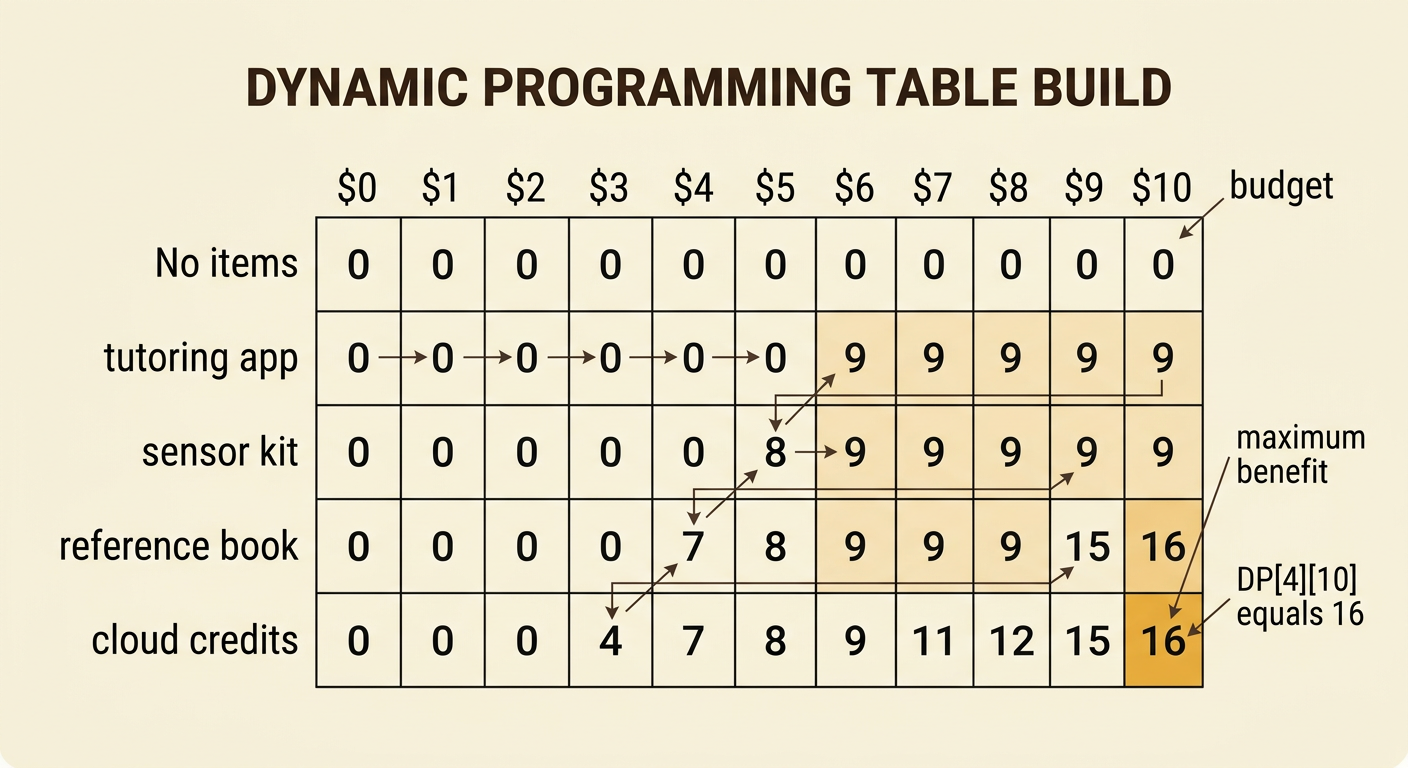
Build the table one item at a time for budgets from $0 through $10. The row with no items contains only zeros. After the tutoring app, the values for budgets $0 through $10 are 0, 0, 0, 0, 0, 0, 9, 9, 9, 9, 9. After adding the sensor kit, they are 0, 0, 0, 0, 0, 8, 9, 9, 9, 9, 9. After adding the reference book, they become 0, 0, 0, 0, 7, 8, 9, 9, 9, 15, 16. The final cloud-credits row is 0, 0, 0, 4, 7, 8, 9, 11, 12, 15, 16. Thus, DP[4][10] = 16, the maximum benefit for the complete problem.
Trace the Selected Items
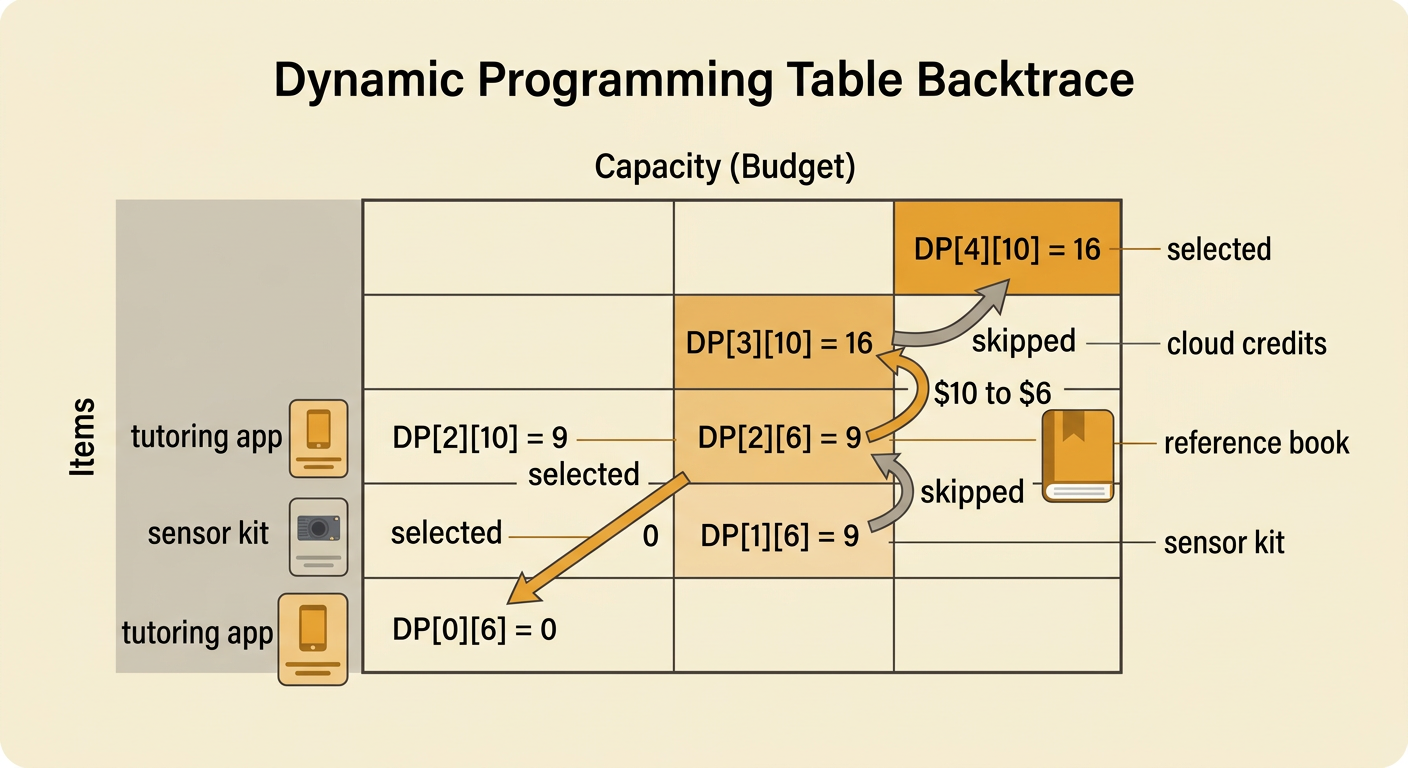
The final value gives the maximum benefit, but tracing backward identifies the selected items. Start at DP[4][10] = 16. It equals DP[3][10], so cloud credits were not needed; move up one row without changing the budget. DP[3][10] = 16 differs from DP[2][10] = 9, so the reference book was selected. Record it and subtract its $4 cost, leaving a budget of $6. At DP[2][6] = 9, the value equals DP[1][6], so skip the sensor kit. DP[1][6] = 9 differs from DP[0][6] = 0, so select the tutoring app and subtract $6. The remaining budget is $0. The traced solution is the app plus the book, costing $10 and providing 16 points.
Evaluate Costs and Benefits
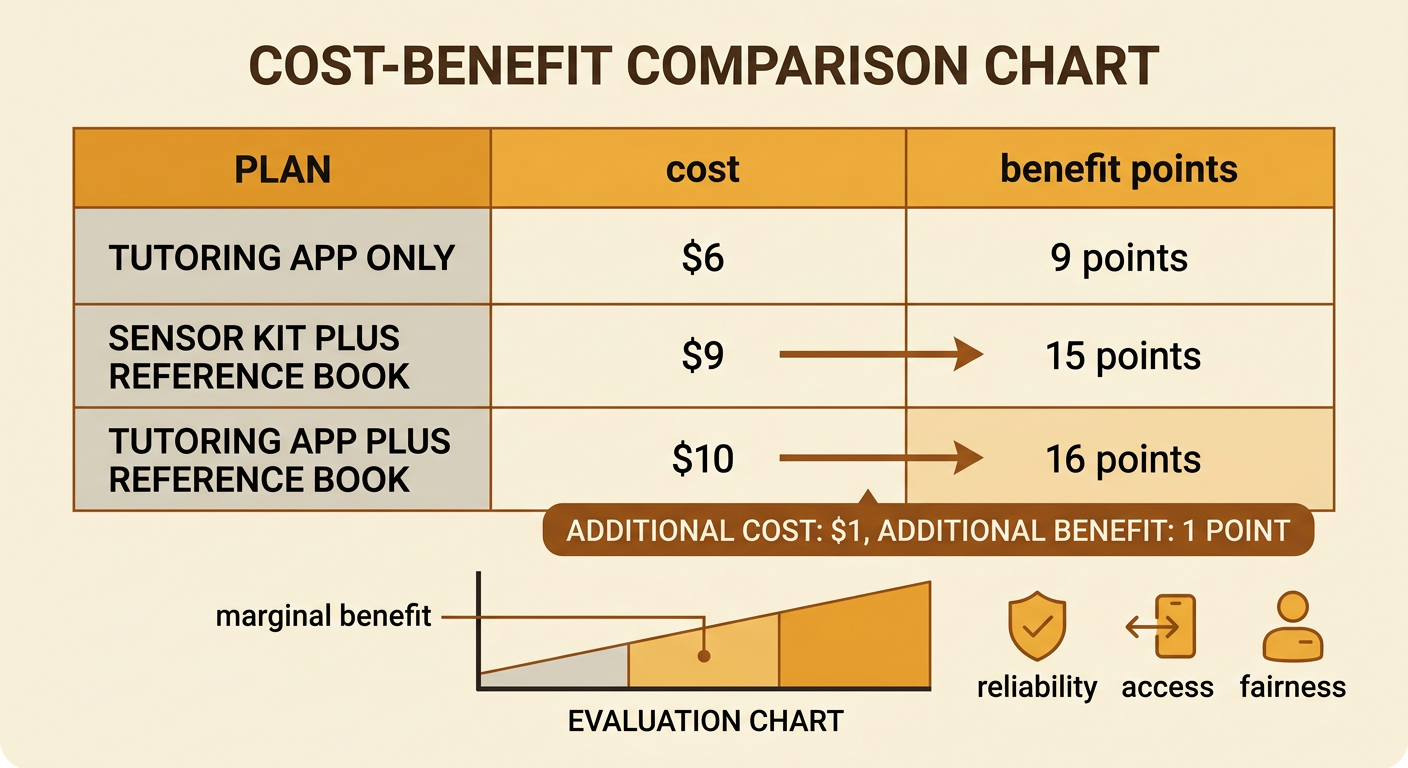
An optimal table value supports a decision, but decision makers should also evaluate what the numbers represent. The app and book use the entire $10 budget and produce 16 benefit points. Compared with the greedy sensor-kit-and-book plan, the optimal plan costs $1 more and adds 1 benefit point. That final dollar has a marginal benefit of 1 point in this comparison. Compared with buying only the app, adding the book raises cost by $4 and benefit by 7 points. The club can argue for the app-and-book plan because it gives the greatest measured benefit under the constraint. However, the argument depends on accurate benefit estimates and on items being indivisible. If reliability, access, or fairness matters but is missing from the scores, the model should be revised before making the real purchase.