Organizing Weather Data with Pictures
Students classify weather pictures into categories and arrange them in a simple pictograph to learn how computers can organize and display data.
Illustrations are auto-generated and may be placeholders. They can be refreshed to match the narration.
What Is Data?
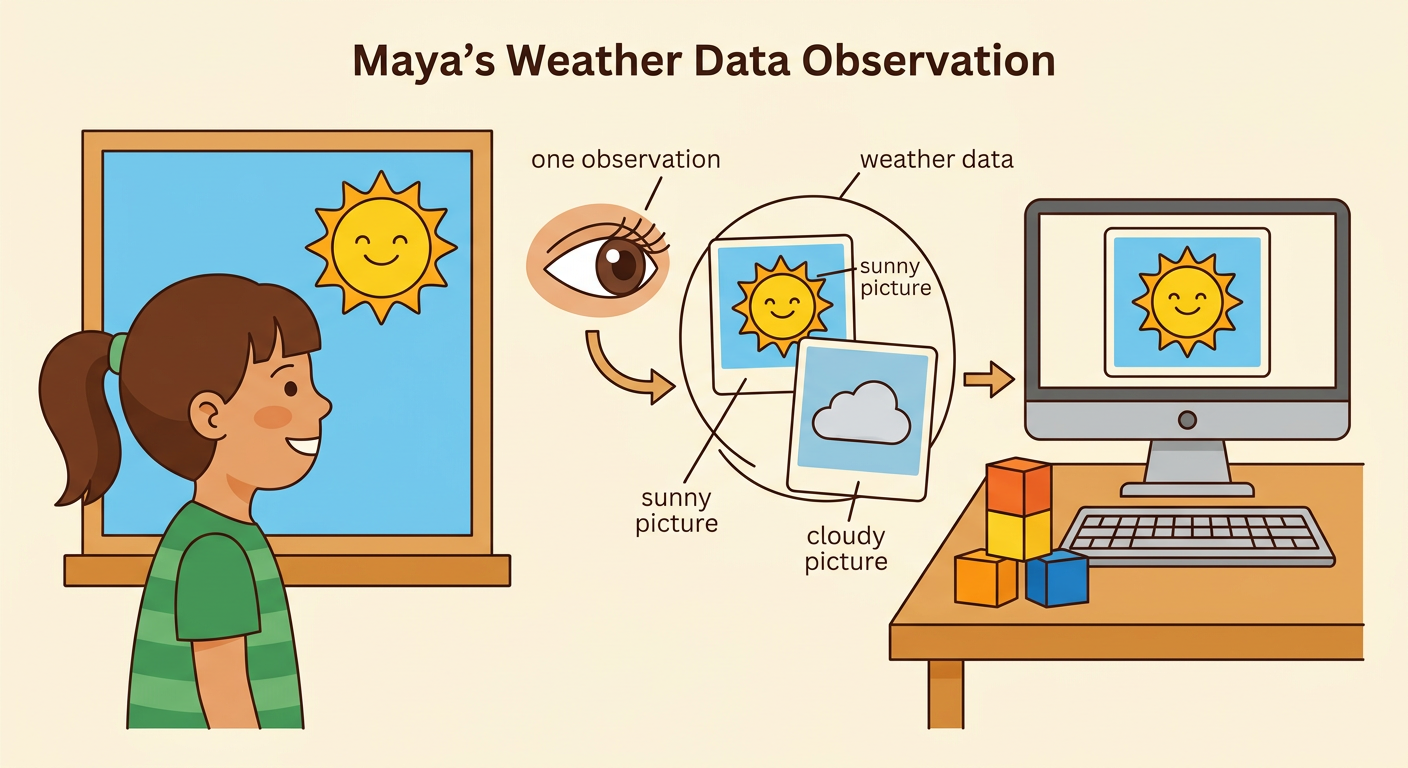
Data is information we collect to help us learn. Weather data tells us what the weather was like at a certain place and time. A weather picture can stand for one observation. For example, Maya looks outside at school on Monday and sees bright sunshine. She chooses a sunny picture to record what she observed. On Tuesday, she may choose a cloudy picture. Each picture is one piece of data. When we put many pieces of data together, we can look for weather patterns. Computers also collect, sort, count, and display data. Organizing our picture cards is a simple way to practice the same kind of work that computers do.
Observe the Weather Pictures
Look carefully at each weather picture before you sort it. Notice clues such as the sun, clouds, raindrops, or snowflakes. Say what you observe without guessing. For example, a card with a dark cloud and falling drops shows rainy weather. A card with the sun peeking from behind a cloud can be placed with cloudy weather if the class rule is to name the main condition. Take turns sharing ideas with your classmates. You might say, “I see raindrops, so I think this card is rainy.” Listen when another student speaks. Careful observing and talking help the class use the same rule for every picture.

Sort Pictures into Categories
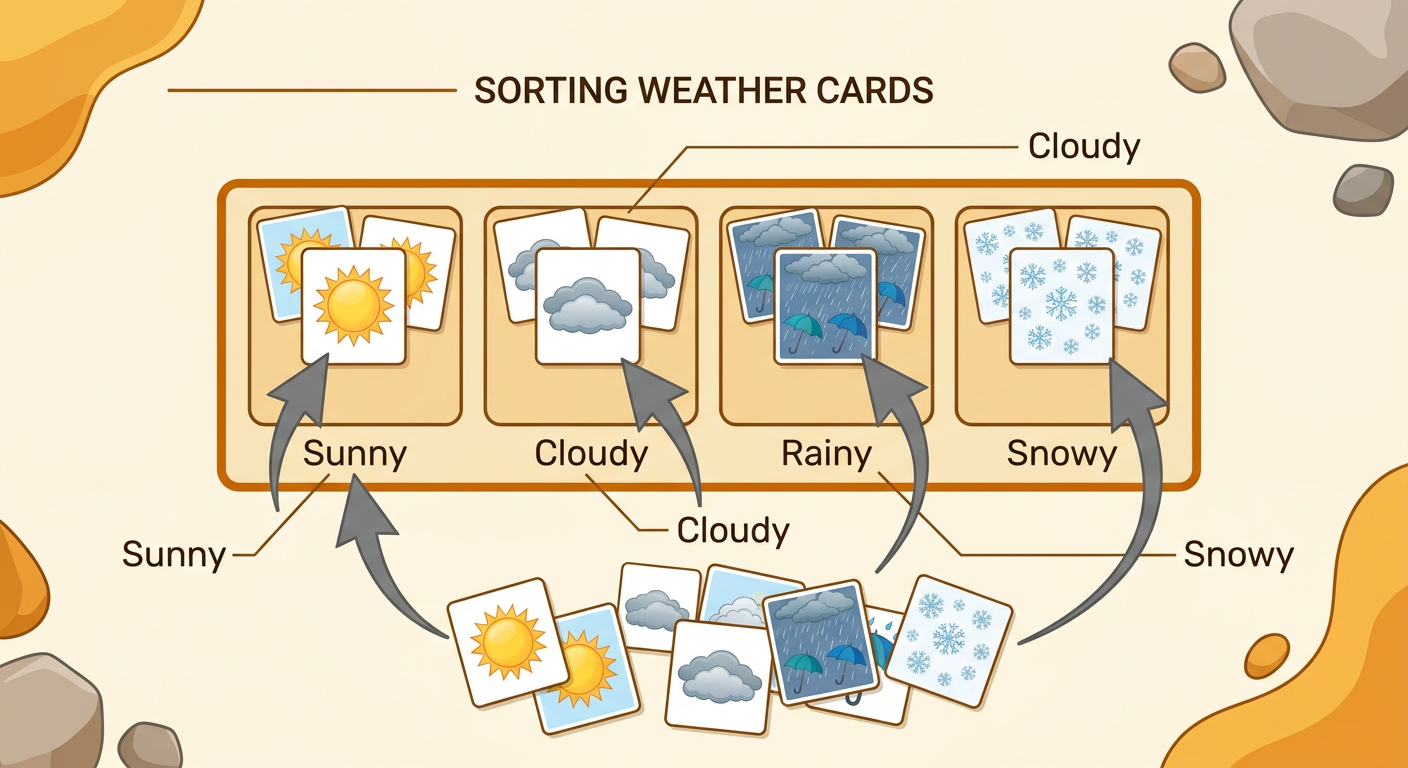
A category is a group of things that are alike. Make four category spaces labeled Sunny, Cloudy, Rainy, and Snowy. Pick up one weather picture at a time. Observe it, name its main weather condition, and place it in the matching group. For example, put a picture with falling snowflakes in the Snowy category. Put a picture with only clouds in the Cloudy category. Continue until every picture has a place. Then check each group with a partner. Ask, “Do all these pictures match the label?” This sorting process follows clear steps, just like instructions for a computer: look, decide, place, and check.
Build a Class Pictograph
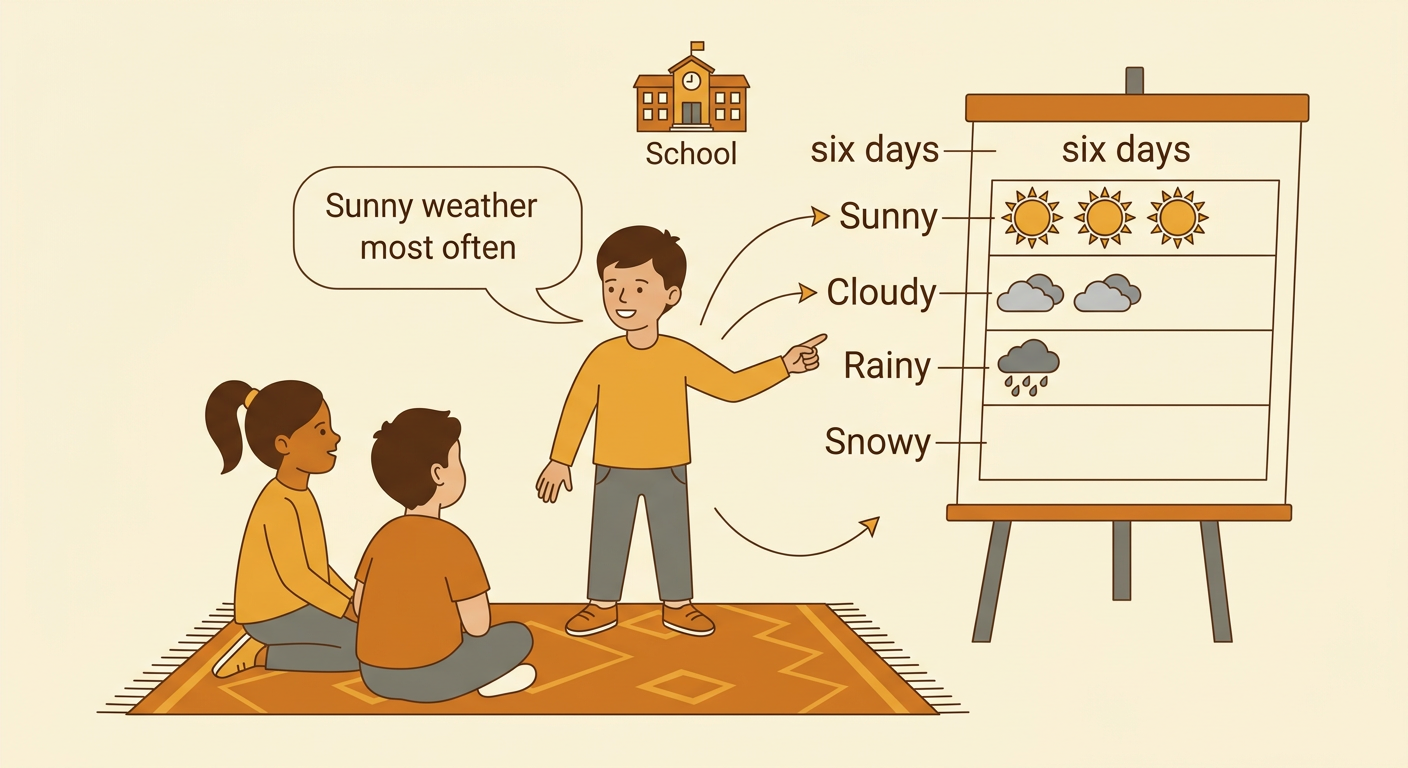
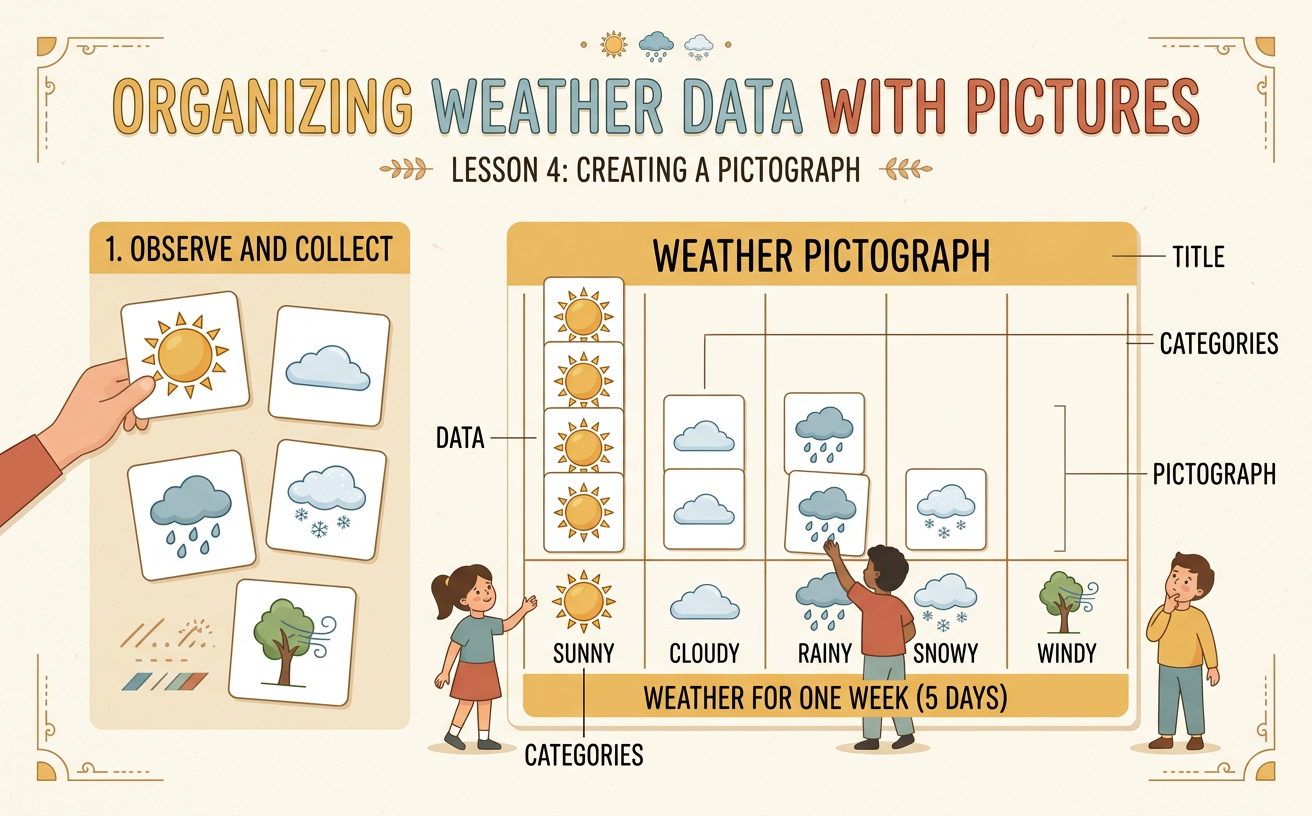
A pictograph uses pictures to show how many items are in each category. Give the graph a title and label each row. Use one weather picture for each day the class observed. For example, suppose the class recorded six days: three sunny days, two cloudy days, one rainy day, and no snowy days. Place three sun pictures in the Sunny row, two cloud pictures in the Cloudy row, and one rain picture in the Rainy row. Leave the Snowy row empty. Add a key that says, “One picture equals one day.” Keep the pictures lined up so the amounts are easy to see and count.

Read the Weather Data
We can read a pictograph by counting and comparing its pictures. Start with one row and touch each picture as you count. In our example, Sunny has three pictures, Cloudy has two, Rainy has one, and Snowy has zero. Sunny has the most days because three is the greatest amount. Snowy has the fewest days because it has no pictures. We can also compare two categories. There was one more sunny day than cloudy day because three is one more than two. Ask and answer questions with a partner, such as, “How many rainy days were there?” Use the graph as evidence for your answer: “There was one rainy day.”

Share a Weather Pattern
A weather pattern is something we notice when we study weather data over time. Use the pictograph to make a true statement about the weather at your school. For example, you might say, “Sunny weather happened most often during our six days of observation.” You could also say, “We observed no snowy days.” Show the graph while you speak so classmates can see your evidence. Take turns, listen, and ask a question about the data. Remember that six days of data describe only those six days at your school. They do not tell us what the weather is always like. Collecting more observations can help the class notice stronger patterns about this place.